
Debug one tab with the DevTools panel
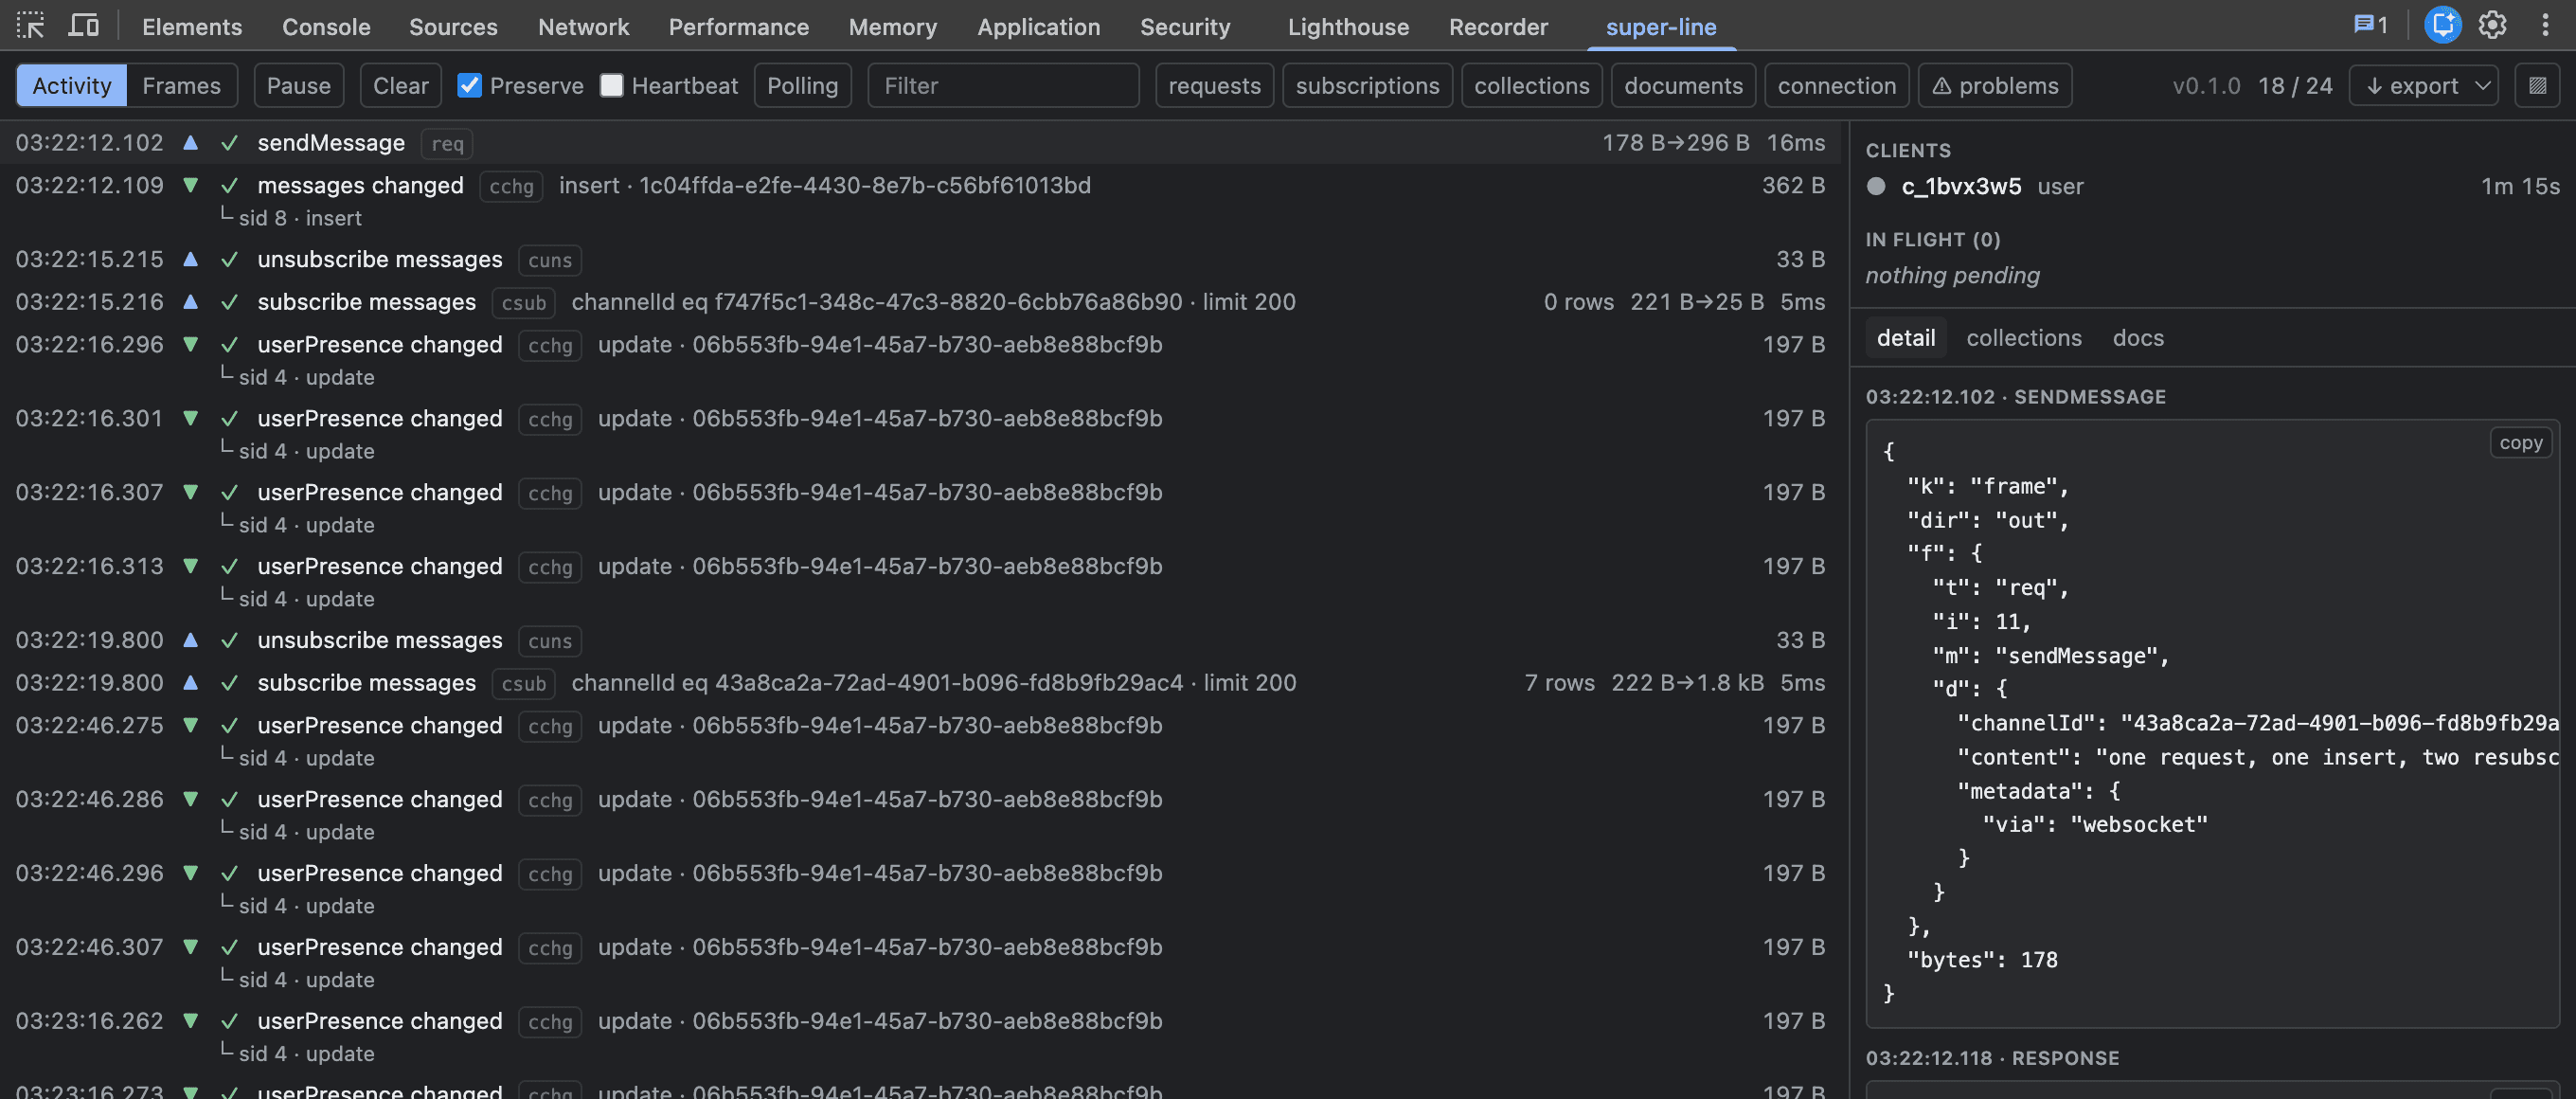
The Control Center answers "what is the cluster doing?". This answers a different question — "what is this page doing?" — and the two barely overlap, because most of what a client knows never reaches the wire.
Use it when the server looks healthy and the page still misbehaves.
Setup
Install the plugin and add it where the client is built:
npm i @super-line/plugin-devtoolsimport { createSuperLineClient } from '@super-line/client'
import { devtoolsPlugin } from '@super-line/plugin-devtools'
const client = createSuperLineClient(api, {
transport: webSocketClientTransport({ url: 'ws://localhost:3000' }),
role: 'user',
plugins: [devtoolsPlugin()],
})Then load the panel and open DevTools → super-line.
It requires no server configuration. There is no inspector to enable, no port to expose, and no credential to manage — it reads the client that opted in, in the page you already have open.
Nothing is observed, buffered or exposed until you add the plugin.
Get the panel
Download the latest super-line-devtools-<version>.zip from Releases and unzip it. Open chrome://extensions, switch on Developer mode, choose Load unpacked, and select the unzipped folder.
If you already have the repo, pnpm --filter @super-line/devtools-extension build produces the same thing in packages/devtools-extension/dist.
It does not auto-update
Chrome auto-updates only extensions it hosts and signs itself, and self-hosting an update feed is limited to enterprise-managed Chrome — so a downloaded panel stays exactly as old as the day you unzipped it. The build version sits in the panel toolbar and in every export; compare it against the Releases page when behaviour looks wrong.
The version banner is a different thing: it fires only when the panel and the page disagree about the wire format. A panel that is merely missing bug fixes says nothing, which is why the version is on screen.
Why not the Chrome Web Store? It would auto-update, and it may still happen. It also means a developer account, per-release review latency, a privacy policy and store assets to keep current — a standing obligation for a tool whose audience already runs npm i and a terminal. The zip has no such tail.
With plugin-auth
authClient calls your own connect, so the plugin goes there:
authClient({
  authedRole: 'user',
  connect: ({ role, params }) =>
    createSuperLineClient(api, { transport, role, params, plugins: [devtoolsPlugin()] }),
})
Expect to see two live clients during a sign-in. That is correct: an identity change builds and confirms its replacement connection before closing the incumbent, so both exist briefly. The panel keeps them in one ordered timeline, which is what makes the handover readable.
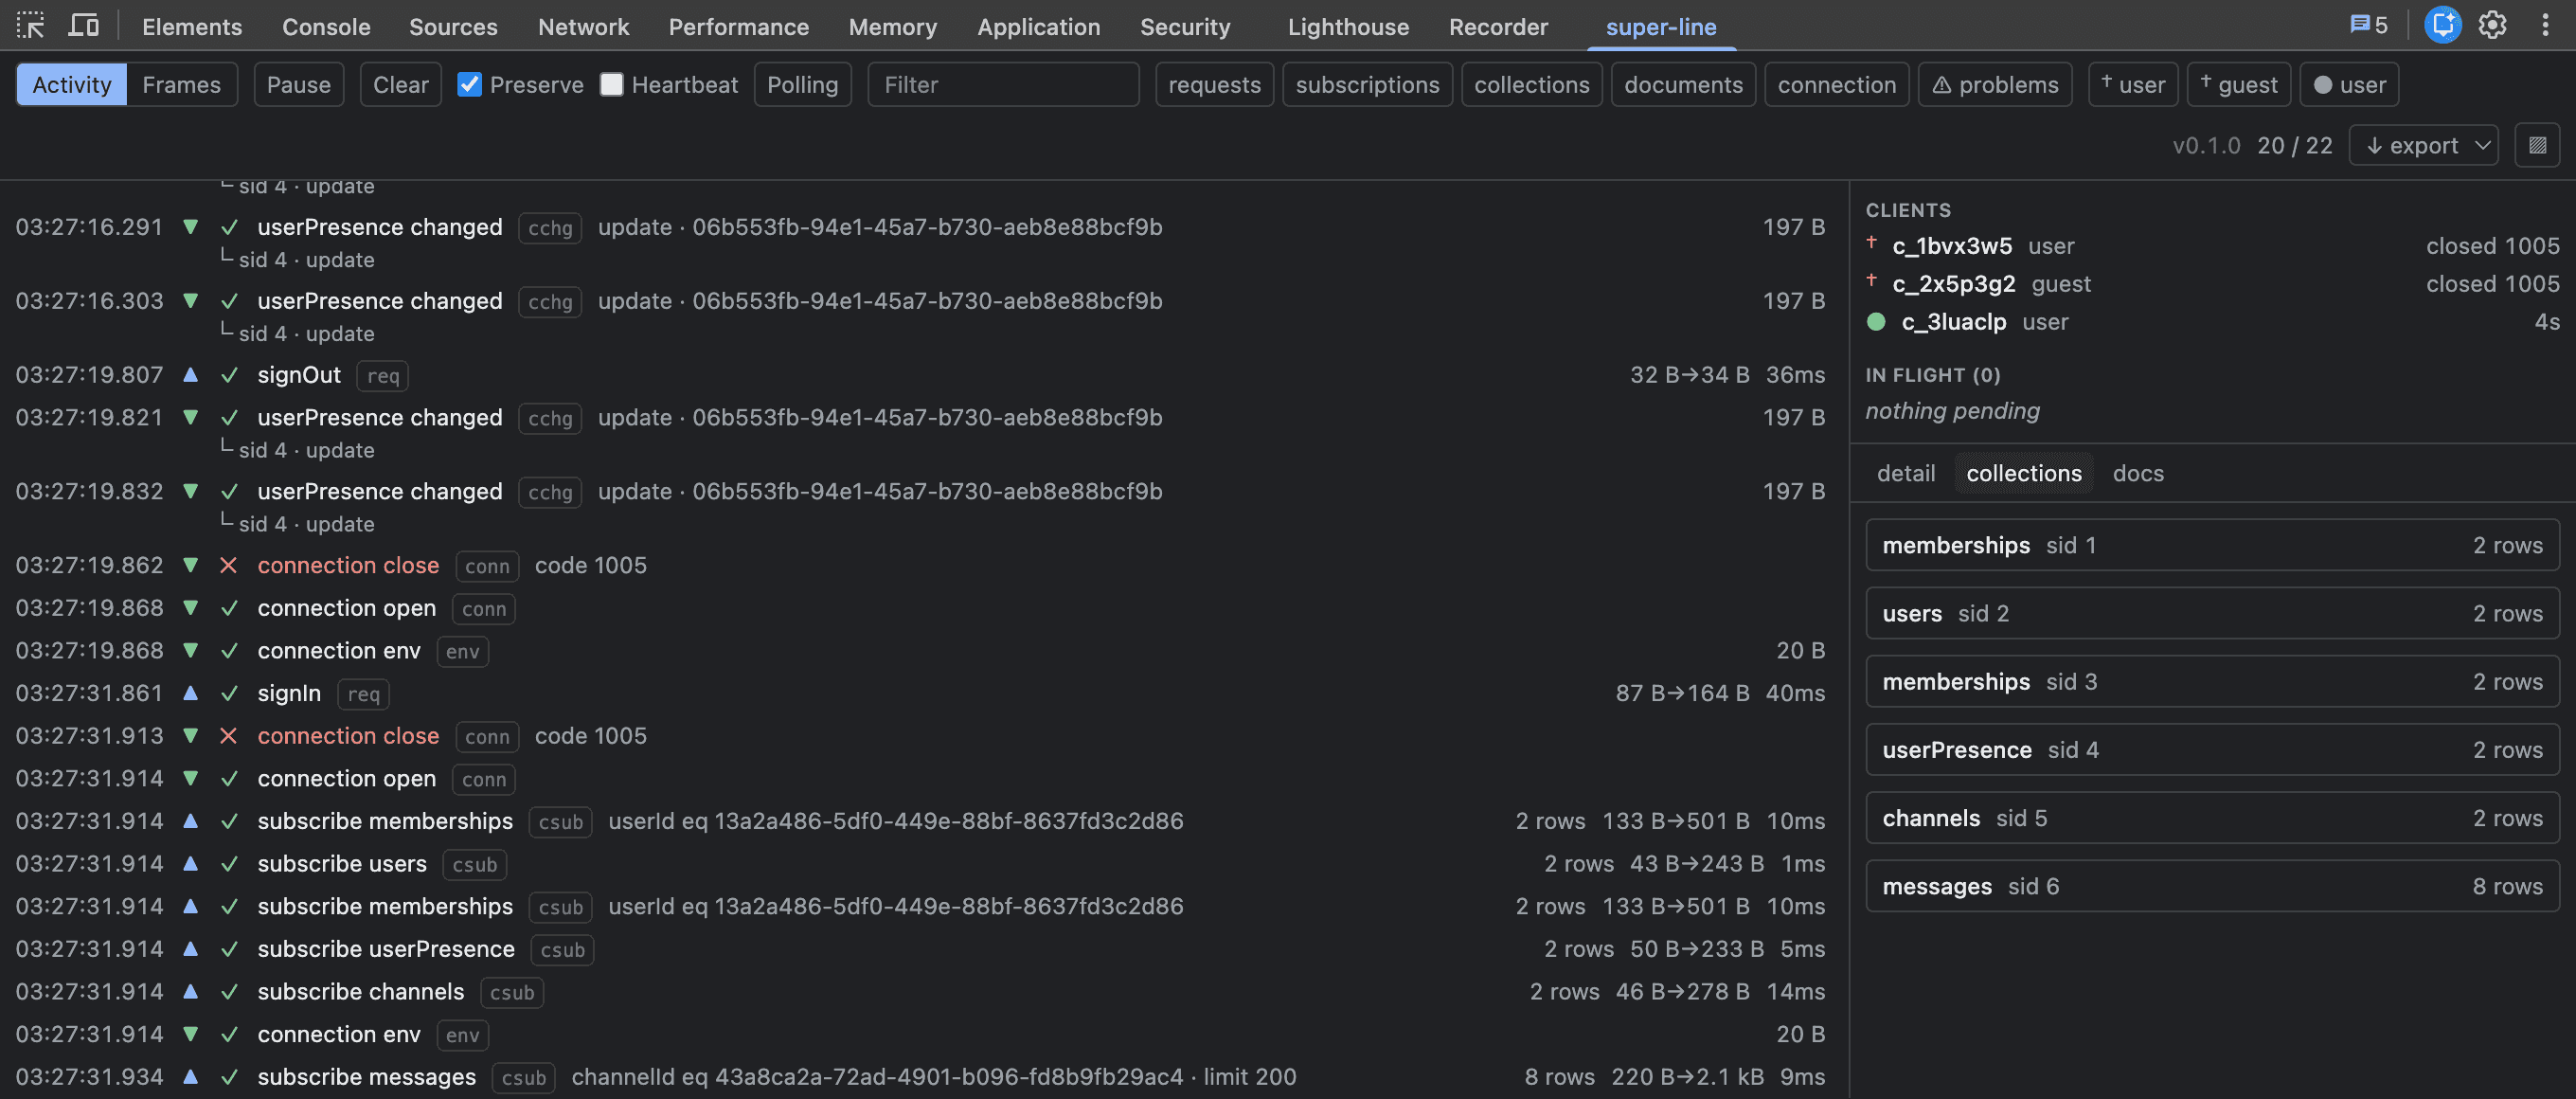
Every client that has existed on this page stays in the rail, daggered once closed, so a handover you missed is still there to read afterwards.
What it shows that a server cannot
| Symptom | What the panel shows |
|---|---|
| "I called it and nothing happened" | the request in In flight, or a queued row meaning it never left the socket |
| "it reconnects forever" | connection retry rows carrying the attempt number and the exact backoff still to wait |
| "a row vanished from my list" | the routing decision per subscription — left-filter (the row still exists, it just no longer matches this query) is a different fact from delete, and the wire frame cannot tell them apart |
| "my handler never fires" | a deliver row reading no listeners — a bug with no server-side symptom whatsoever |
| "the document stopped updating" | a doc row reading no open replica: the delta arrived for a document this client had closed |
| "the payload looks wrong" | the row set the client is actually holding, and CRDT document contents — which cross the wire only as opaque deltas |
The Collections and Docs tabs read the client's own state rather than a reconstruction of it, so what you see is what the client is holding, not what the panel guessed from the traffic.
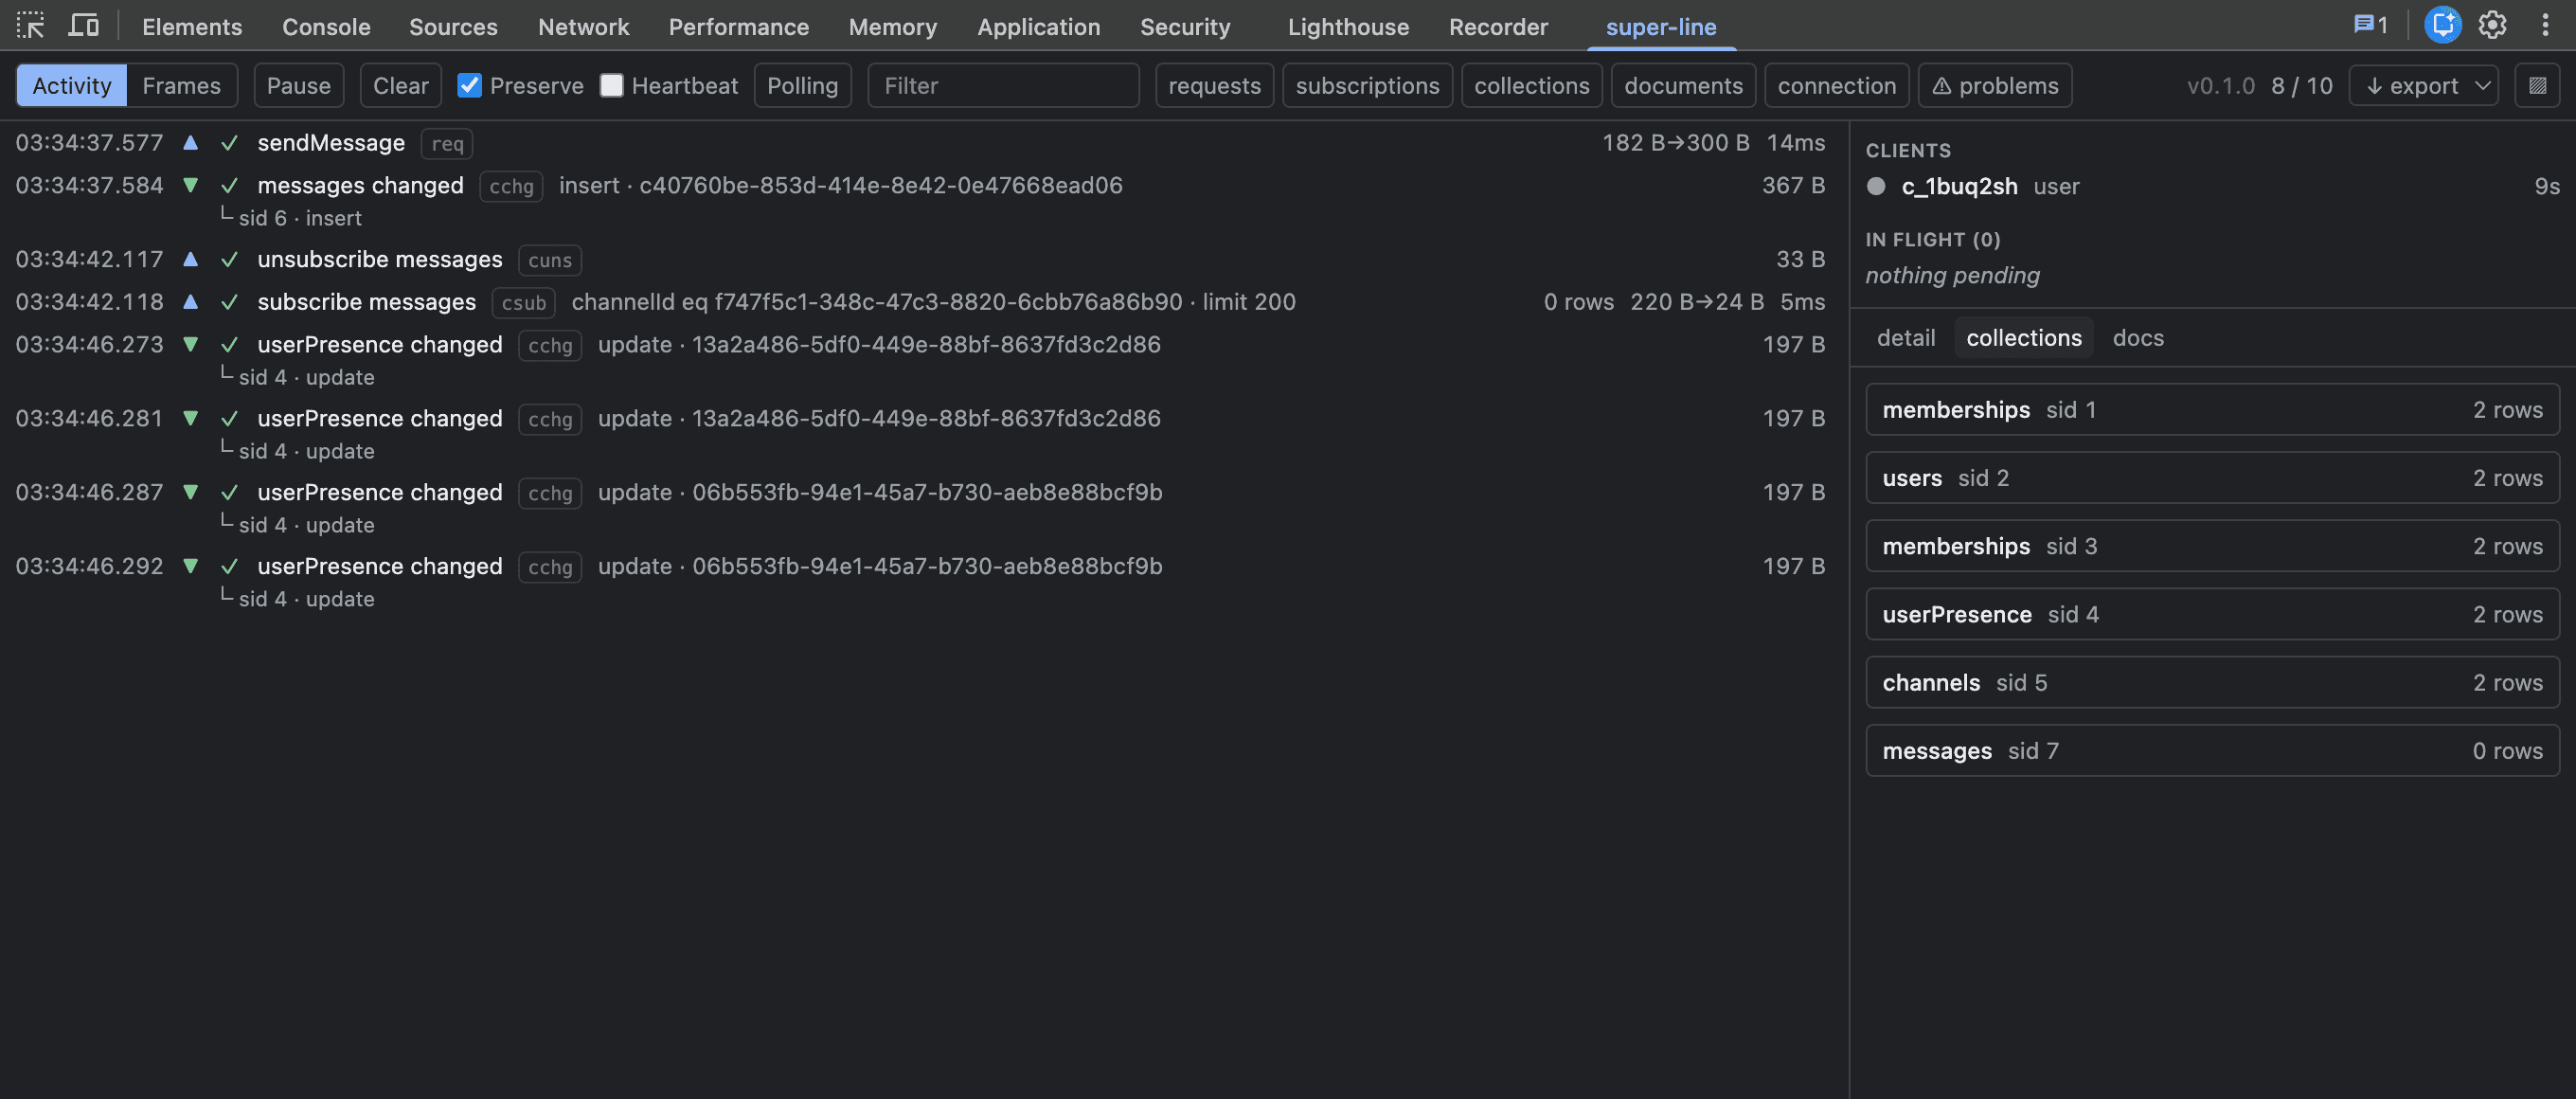
Every category also has a problems axis that cuts across all of them at once — failures, timeouts, rejected payloads and zero-listener deliveries, wherever they came from.
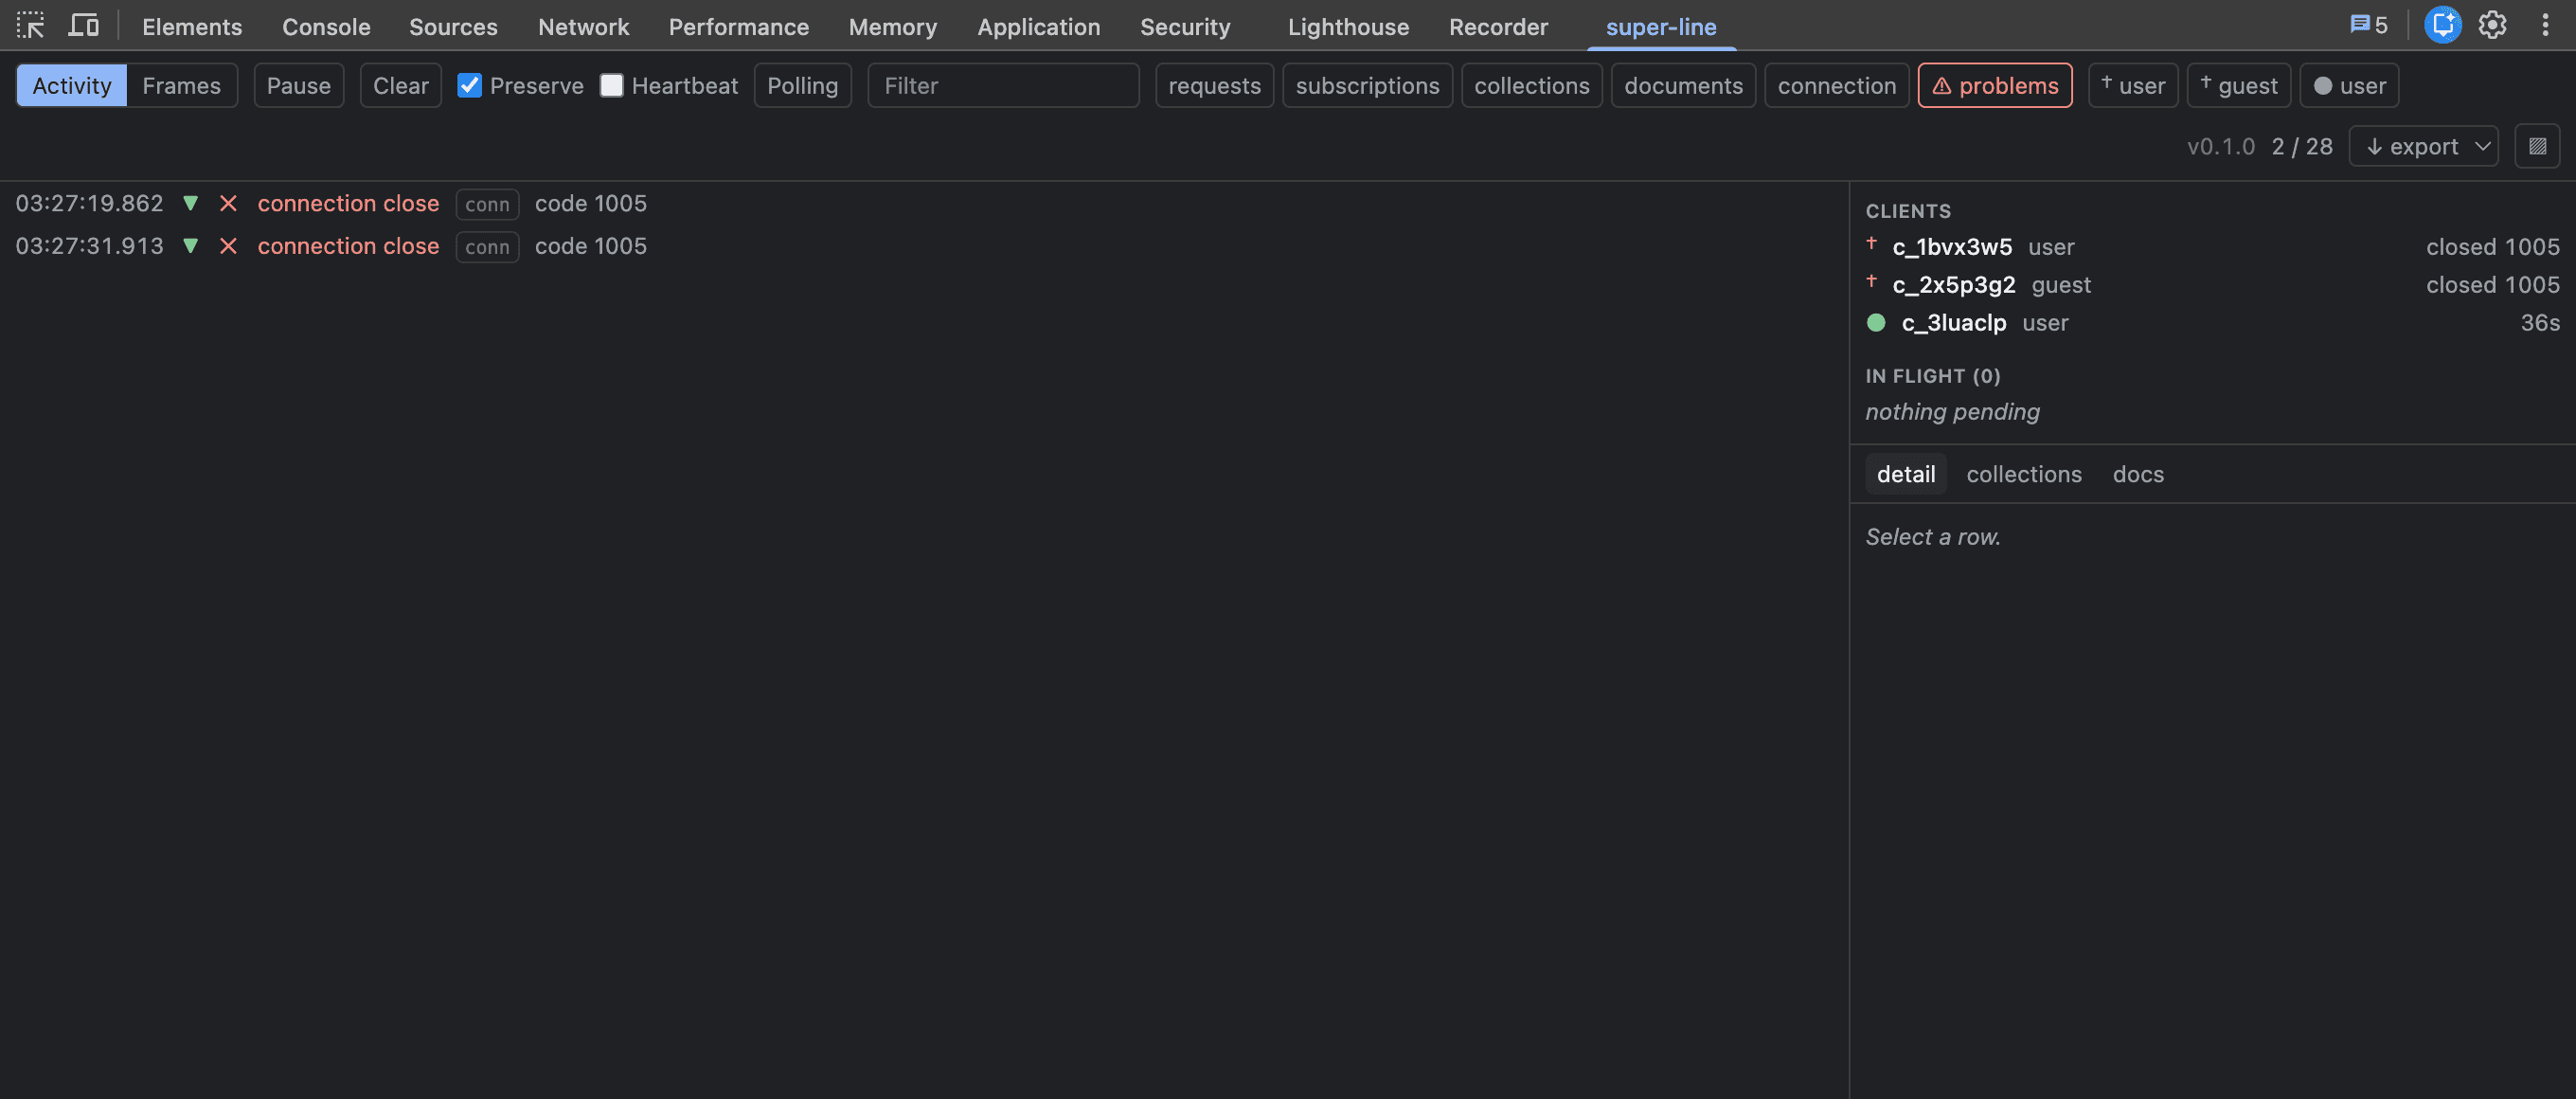
Two views of the same traffic
Activity merges a request and its response into one row, which is the pairing you would otherwise do by eye. Frames does not merge anything: every frame is its own row, routing decisions included, which is what you want when the question is what actually crossed the wire and in what order.
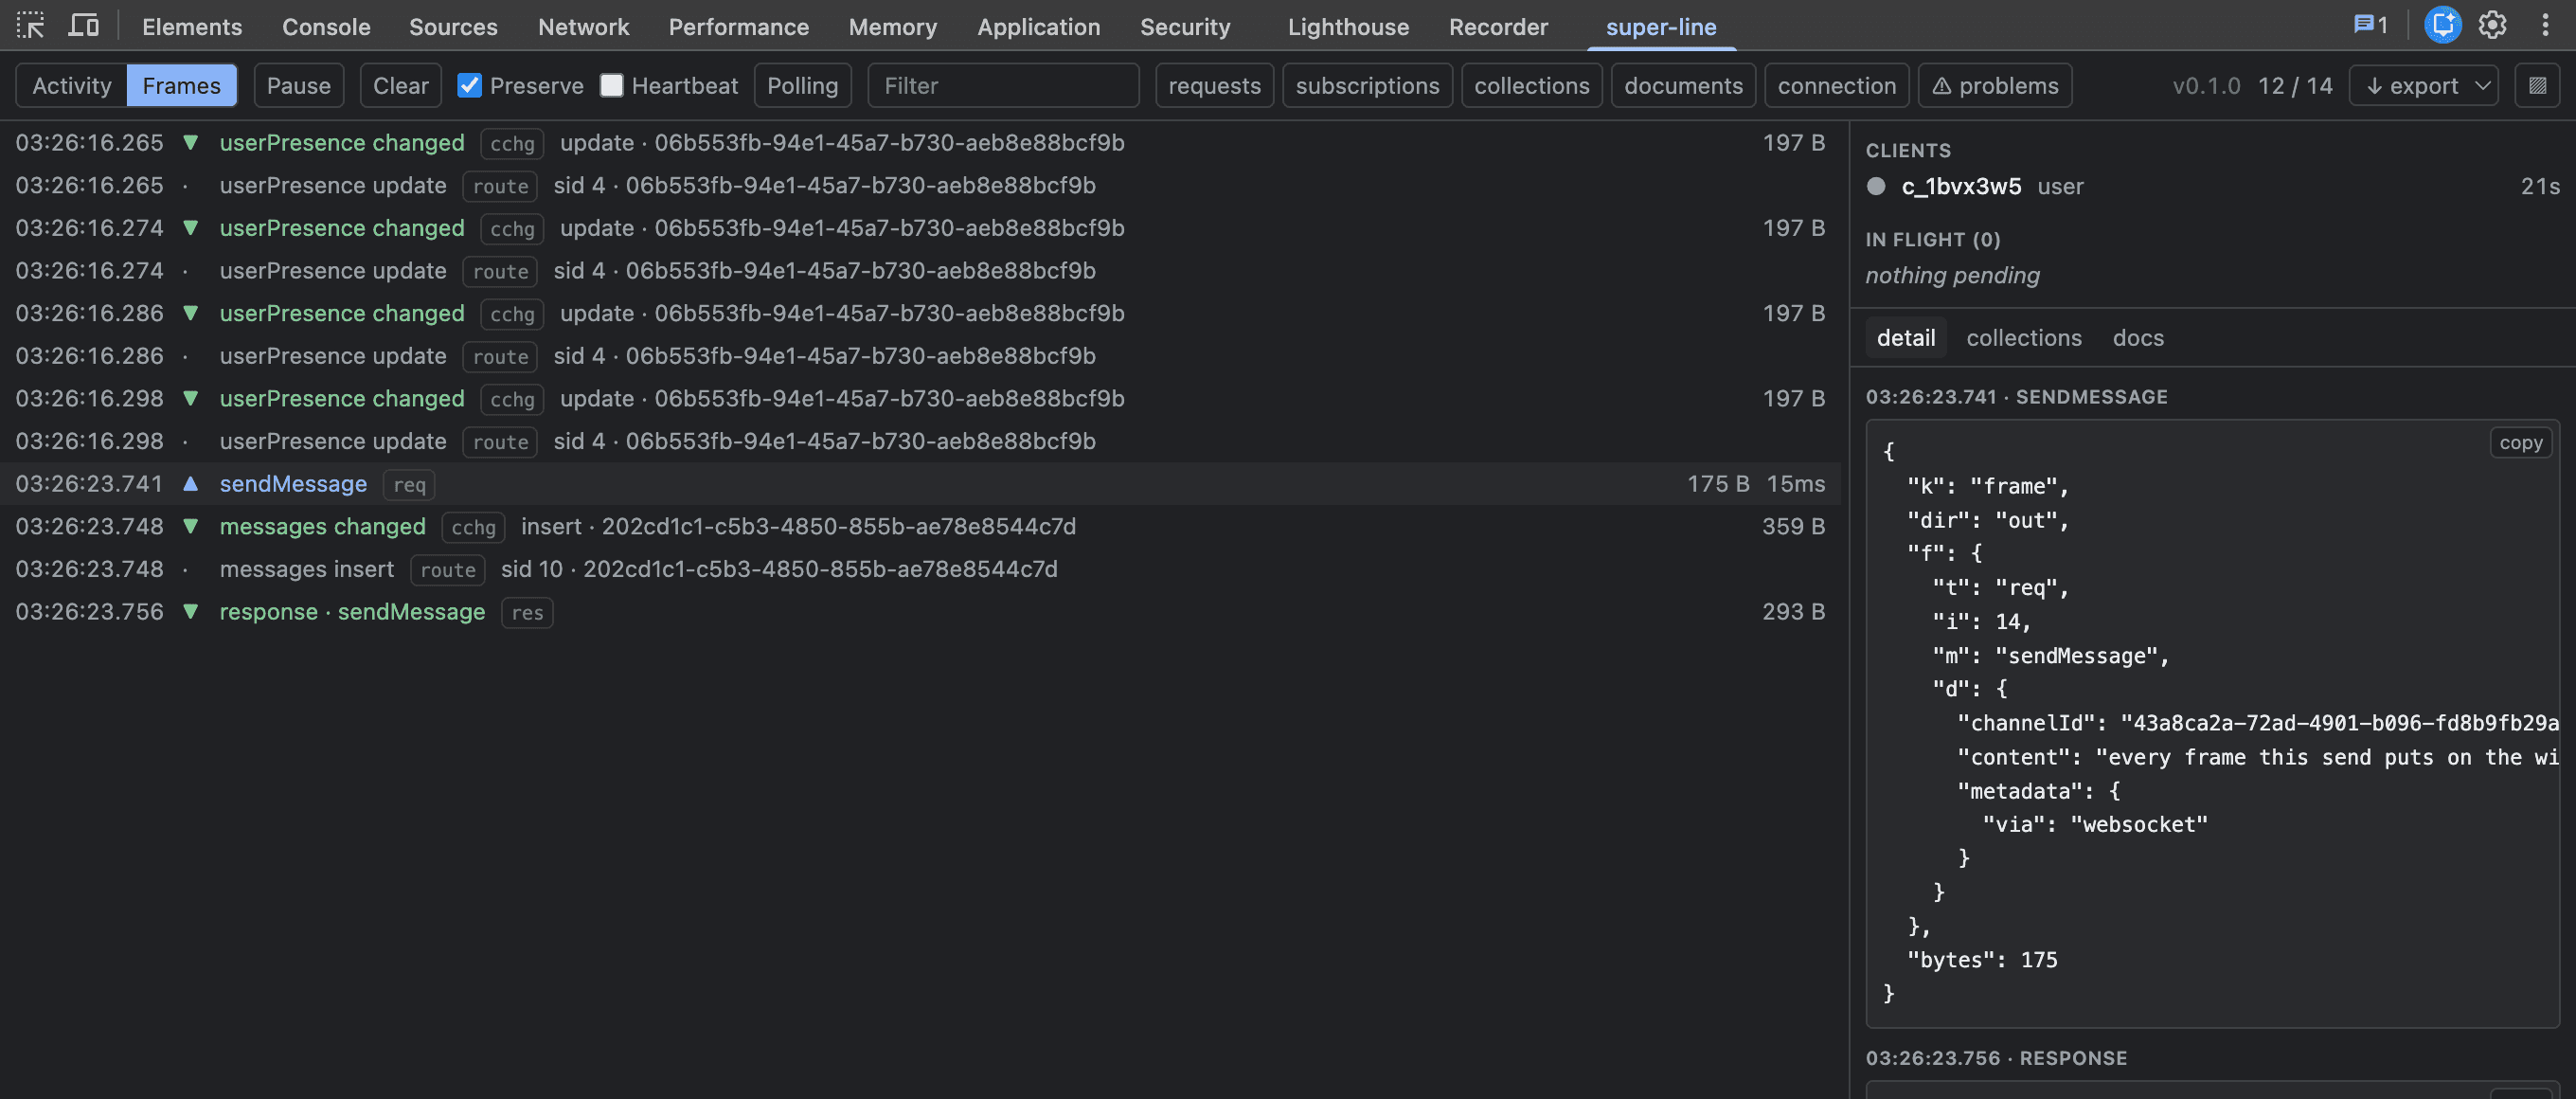
Polling and live push
The extension installs with no permission warnings and starts polling immediately. That is the whole feature working.
The Polling / Live button upgrades the current origin to live push, which needs a one-click permission grant for that origin only. Declining costs latency and nothing else: polling stays authoritative, and if the buffer ever has to evict records the panel renders a visible gap with the count rather than quietly skipping them.
Options
devtoolsPlugin({
  maxEvents: 5000,      // ring capacity
  redact: ['token'],    // mask these field names at every depth before buffering
})
Payloads are snapshotted as they arrive, so the buffer never pins an application object alive and never shows one that has since been mutated.
redact governs what ends up in a screenshot, not who may read it — the buffer lives in the page's own memory, which any script on the page can already reach. Treat it as a convenience, not a security boundary.
Tapping the client yourself
The plugin is one consumer of a general seam. Any client plugin can observe the same stream:
const audit: SuperLineClientPlugin = {
  name: 'audit',
  onClientSideEvent: (event) => {
    if (event.k === 'deliver' && event.listeners === 0) {
      console.warn(`'${event.name}' arrived with nobody listening`)
    }
  },
}
It carries wire frames verbatim plus the client-local decisions above, fires synchronously with live payload references (do not mutate them; snapshot anything you keep), and is isolated — a throwing tap is routed to onError as kind: 'tap' and never fails the operation it was watching.
A plugin's setup(ctx) additionally receives clientId, role, and the accessors getPending / getTopics / getCollectionSubs / getOpenDocs / getDocSnapshot.
The name is deliberate
The server plugin's tap is onEvent; the client plugin's is onClientSideEvent. They carry different vocabularies — the server's speaks of connId, role and nodeId, none of which a client has — so the two halves of a plugin pair look symmetric here and are not.