
Inspect a cluster with Control Center
One screen for your entire cluster: which node owns which socket, who's in which room, the live contract, and every message crossing the bus in real time. No console.logs, no extra instrumentation — mount one plugin and point the Control Center at any node.
It ships as @super-line/control-center and runs with npx — no install.
Enable the inspector
The inspector ships as the plugin @super-line/plugin-inspector. Mount it with plugins: [inspector()] on any node — it contributes a node-local tap (the msg.* telemetry) and a plugin-owned connection class the Control Center attaches to over the reserved superline.inspector.v1 subprotocol. The server is the single authority: the WS transport advertises that subprotocol only because the plugin declared it. It is off by default:
import { createSuperLineServer } from '@super-line/server'
import { webSocketServerTransport } from '@super-line/transport-websocket'
import { inspector } from '@super-line/plugin-inspector'

const srv = createSuperLineServer(contract, {
  transports: [webSocketServerTransport({ server })],
  authenticate,
  plugins: [inspector()],
})
Inspector connections bypass authenticate, are read-only, and are kept out of presence, the heartbeat, and local/cluster results — so the observer never shows up in what it observes.
Migrating from inspector: true
Earlier versions enabled the inspector with an inspector: true server option (and a matching transport option). Both are gone — the inspector is now a plugin. Add the dependency and mount it:
// before
const srv = createSuperLineServer(contract, { transports, authenticate, inspector: true })

// after — pnpm add @super-line/plugin-inspector
import { inspector } from '@super-line/plugin-inspector'
const srv = createSuperLineServer(contract, { transports, authenticate, plugins: [inspector()] })
The old inspector.redact option becomes inspector({ redact: ['token'] }). The wire, the superline.inspector.v1 subprotocol, and the Control Center are unchanged — only the mount point moved.
Unlocked by default
Mounted bare, inspector() serves anyone who can reach the port — the whole contract, cluster topology, every connection's ctx, the live message feed, and every collection's rows with row policies deliberately bypassed. The plugin warns about this at boot on the ['super-line','plugin-inspector','auth'] log category. Lock it before the port is reachable by anything you don't trust, and never mount it on an internet-facing production node. (A redact option masks specific ctx/data field names: inspector({ redact: ['token'] }).)
Run it
npx @super-line/control-center --url ws://localhost:3000This serves the app on a local port and opens your browser. Change the endpoint from the Settings page at any time, or pass --port to pick the local port.
Locking the inspector
Set a password and the Control Center must present it to connect:
SUPER_LINE_INSPECTOR_PASSWORD=s3cret node server.jsThe username defaults to admin; override it with SUPER_LINE_INSPECTOR_USER. Or configure it in code, which takes precedence over the environment:
plugins: [inspector({ auth: { username: 'admin', password: process.env.CC_PASSWORD! } })]Enter the two values under Settings in the Control Center. They're stored in your browser separately from the URL — so the URL stays safe to display, copy, and share as a ?url= link — and travel as handshake parameters on each dial. Rejected credentials show as a distinct unauthorized state rather than a generic disconnect, and auto-retry stops (replaying a wrong password only earns another refusal).
Every node needs the credential configured, since the Control Center attaches to one node at a time.
For a host that already runs plugin-auth, auth also takes a predicate over the raw handshake — reject by throwing, and the message reaches the browser as the reason:
plugins: [
  inspector({
    auth: async (handshake) => {
      const verified = await authKit.tokens.verify(handshake.query.jwt ?? '')
      if (!verified?.roles.includes('admin')) throw new Error('admin role required')
      return { userId: verified.userId }
    },
  }),
]
Whatever the check returns becomes the connection's ctx.
The password rides the query string
Credentials travel as handshake parameters, so a reverse proxy in front of your node will log them, and the Control Center re-dials every second while disconnected. Use wss:// and treat this as a lock on a dev tool, not an admin console.
The views
Topology
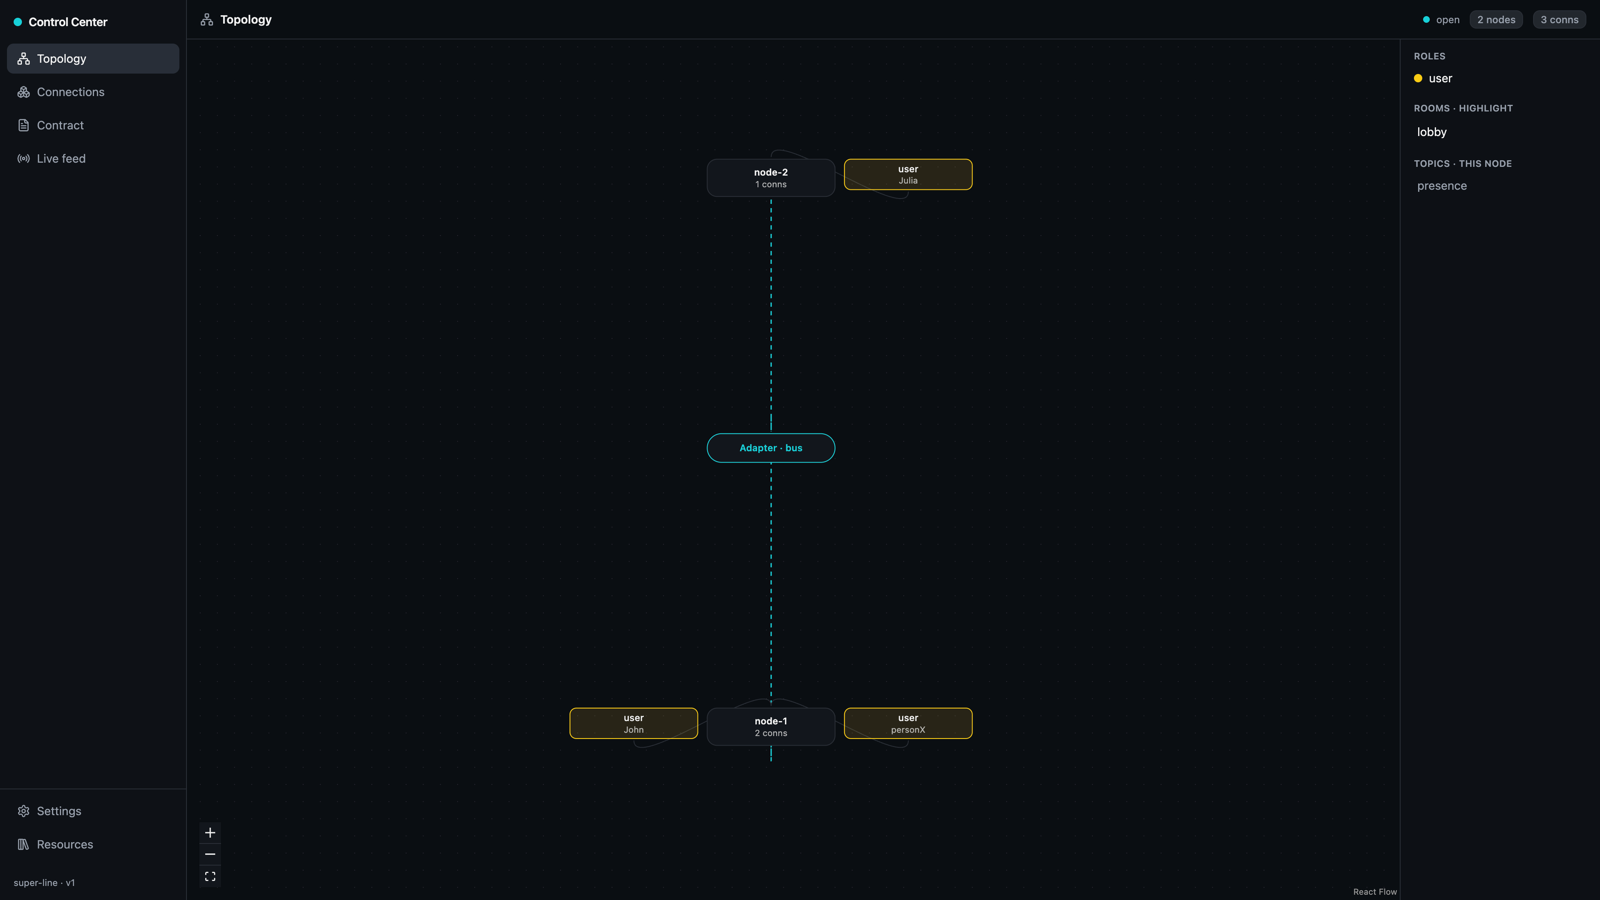
A hub-and-spoke graph of the whole cluster. The Adapter · bus sits at the center (multi-node clusters only — nodes have no direct sockets, they coordinate through the bus), server nodes around it, and each connection around its owning node. Connection nodes are colored by their wire family (WebSocket / HTTP / libp2p / loopback), and each server node labels its wire mix (e.g. 3 ws / 2 http). A side lens lists roles as a color legend, the wire families in play with live counts, the connected users, the rooms, and this node's topics — click a user, a room, or a wire family to highlight its connections across every node. The graph updates on every live event.
When @super-line/plugin-auth is on the server, each connection node is labelled with the user's display name over its role and connection id, instead of a raw user key — so a person holding six connections reads as one person on six wires rather than six identical user boxes. Without the plugin (or before a directory row arrives) nodes fall back to role + id.
Connections
A table of every connection cluster-wide — role, transport, id, user, owning node, rooms, and uptime. With plugin-auth on the server the user column shows the display name over the short user key (the key stays visible — it is what correlates a row with the live feed and the drawer). The transport column is the wire each connection was accepted on, shown with a friendly label (WebSocket, HTTP · SSE, HTTP · long-poll, libp2p, Loopback) and color-keyed to the same wire-family palette as the topology graph — so a mixed-transport cluster is legible at a glance.
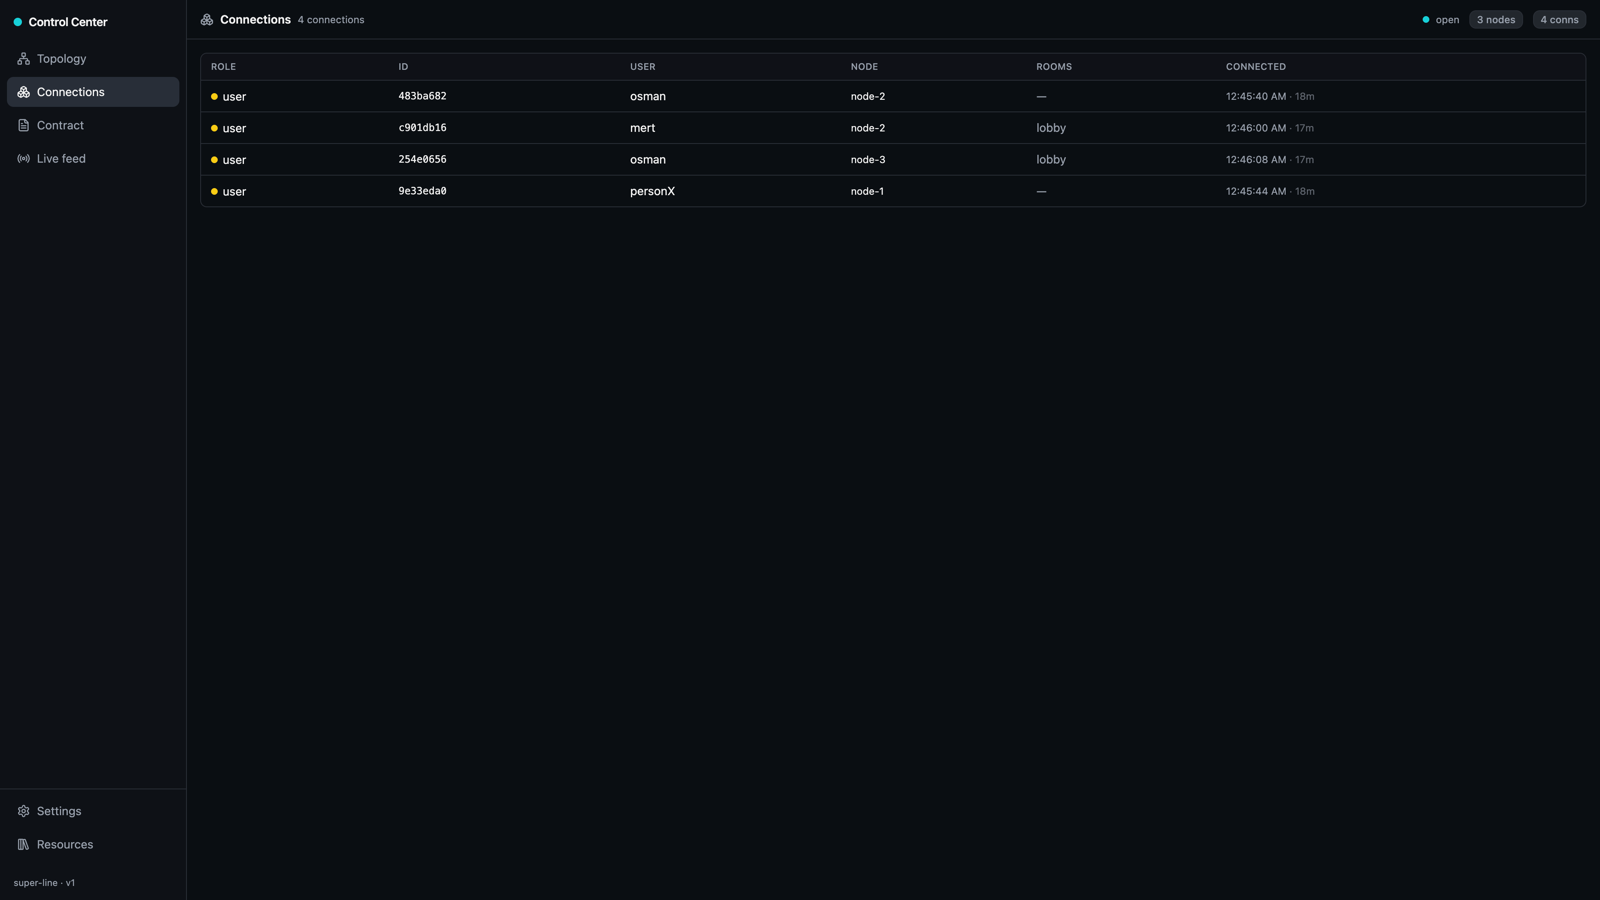
Click a row to open its descriptor — including the wire it came in over — plus a best-effort, node-local snapshot of ctx, conn.data, and, when the role declares one, conn.env — the server-vended, client-visible env. env is masked by default (the opposite of ctx/data): values render as ••• unless the key is allow-listed via inspector({ revealEnvKeys: [...] }). A connection owned by another node shows descriptor-only — point the Control Center at that node to read its ctx.
With plugin-auth, the drawer leads with a user section drawn from the auth directory: display name, user key, the user's roles, when the account was created (and whether it is deactivated), and the host's opaque metadata. It comes from the directory rather than ctx, so unlike ctx it is present for connections owned by any node.
Contract
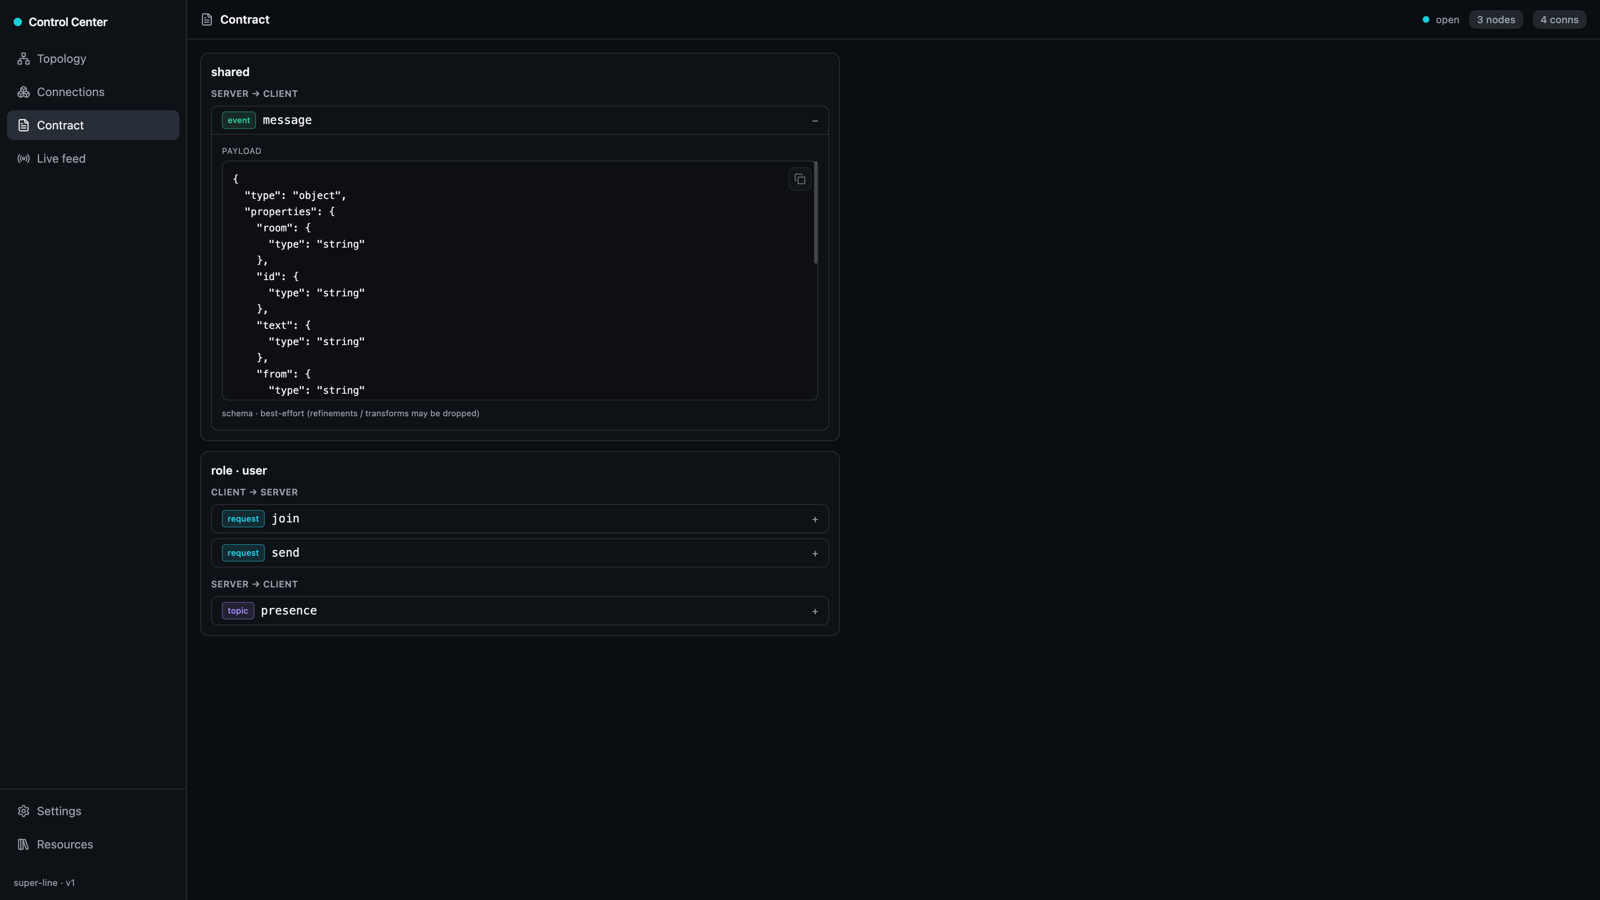
The full contract surface: shared and each role, split by direction with a flavor badge (request / event / topic) and an expandable best-effort JSON Schema per message. Entries contributed by a contract plugin also carry the plugin's name, so a surface merged from several plugins stays attributable; entries your app declared itself are unmarked.
Plugins
What the server is composed of: every plugin, with its two independent halves — whether a runtime plugin of that name is registered, and whether it merged a contract fragment — plus the collections and messages that fragment contributed. Most plugins have both halves; the inspector itself is runtime-only. A plugin showing contract but not runtime is a misconfiguration worth catching: the fragment was merged (so the calls type-check) but no server half is registered, and those requests will fail with NOT_FOUND at call time.
Collections
Every declared collection, with the plugin that declared it (if any), its schema (fields + primary key) and advisory foreign-key edges, plus a row browser that scans the backend directly — bypassing row policies, since the inspector is a trusted observer. Each row lists its id, created, updated, and full row JSON; click a row for the pretty-printed detail. CRDT document collections browse here too, as { id, ...snapshot } doc-rows.
Filter with a builder of field · operator · value conditions that AND together and are pushed to the server as a query — so they narrow the whole collection, not just the rows already loaded. Operators are offered by field type (strings: = · ≠ · contains; numbers: = ≠ < ≤ > ≥; booleans: is). The created and updated timestamps are filterable too — after / before a datetime, or within last N minutes/hours/days (evaluated inspector-side, since they live outside the row data). CRDT collections aren't content-queryable, so their filter is an id contains substring. A separate quick-find box does a client-side substring over the currently-loaded rows. Sort by clicking the id, created, or updated column header (toggles ascending/descending), also pushed to the server so it orders the whole collection before paging.
This is also where you watch a queue. plugin-queue's three collections — queueJobs, queueSchedules, queueSlots — are deny-all for clients, but the inspector is a trusted observer, so the row browser is a live job list: filter queueJobs by status or queue name to see what is pending, running, or failed, sort by updated to find the job that just moved, and read queueSlots to see which node holds which lease. The queue-cluster example ships a Control Center alongside its dashboard for exactly this.
The created / updated columns are per-row store metadata the backend tracks (epoch ms) and the inspector surfaces here — they are Control-Center-only and never part of your row schema. Relay backends (collections-memory / -sqlite) stamp them on the handling node; the self tier (collections-pglite) stamps them once on the central Postgres clock. A store upgraded from before these columns existed backfills its existing rows with the upgrade time. (Sorting a row collection by created/updated is done inspector-side, since those timestamps live outside the queryable row data — fine for a dev inspector, not tuned for huge collections.)
Live feed
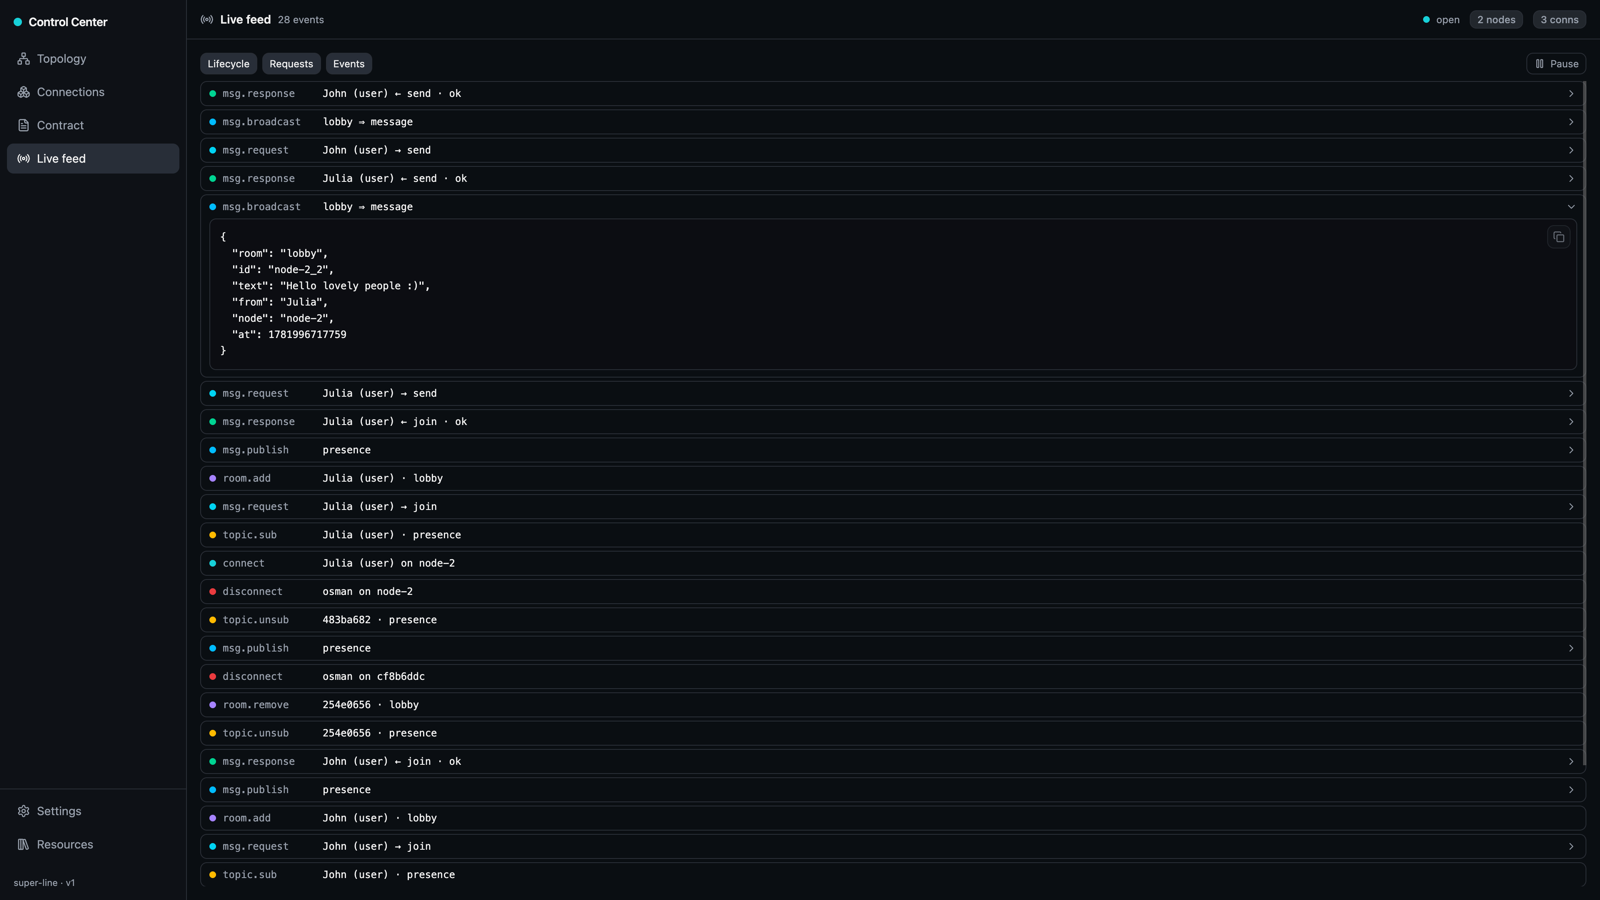
Lifecycle churn — connect / disconnect / room.add / room.remove / topic.sub / topic.unsub — published on a reserved channel and fanned out cluster-wide via your Adapter, so an inspector on any one node sees events from every node.
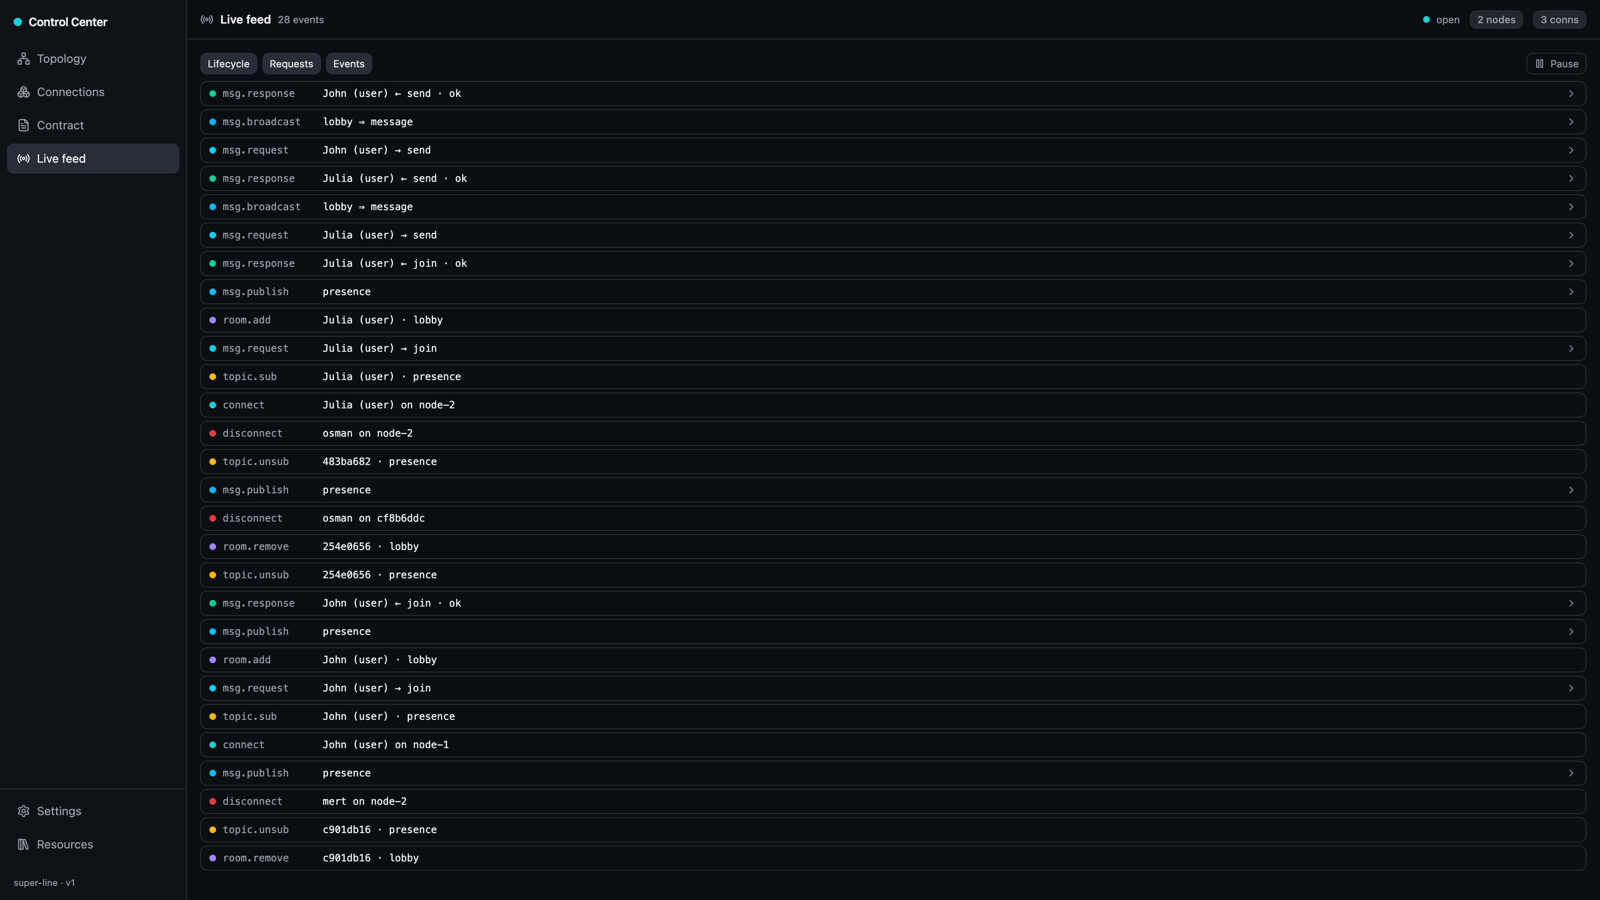
It also streams message traffic — msg.request / msg.response / msg.broadcast / msg.publish / msg.event, plus msg.serverRequest / msg.serverReply between nodes — collection traffic: row writes and CRDT-document edits (collection.sub / collection.write / collection.change, crdt.open / crdt.write / crdt.change / crdt.delete) — and env traffic: env.set, whenever a connection's server-vended env is seeded or updated. Filter by Lifecycle, Requests, Events, Collections, or Env, pause the stream, and expand any row to inspect its payload (redacted per your inspector({ redact }) config — an env.set row is masked per revealEnvKeys instead, same as the connection detail above).
CRDT deltas are opaque on the wire, so a crdt.write / crdt.open row expands to the decoded post-merge document snapshot the server validated — the readable state after the edit, not the binary delta — while a crdt.change fan-out shows the writer origin and delta size. A server-side agent co-writing a document (as in examples/ai-canvas) therefore shows up as crdt.write rows stamped with its origin.
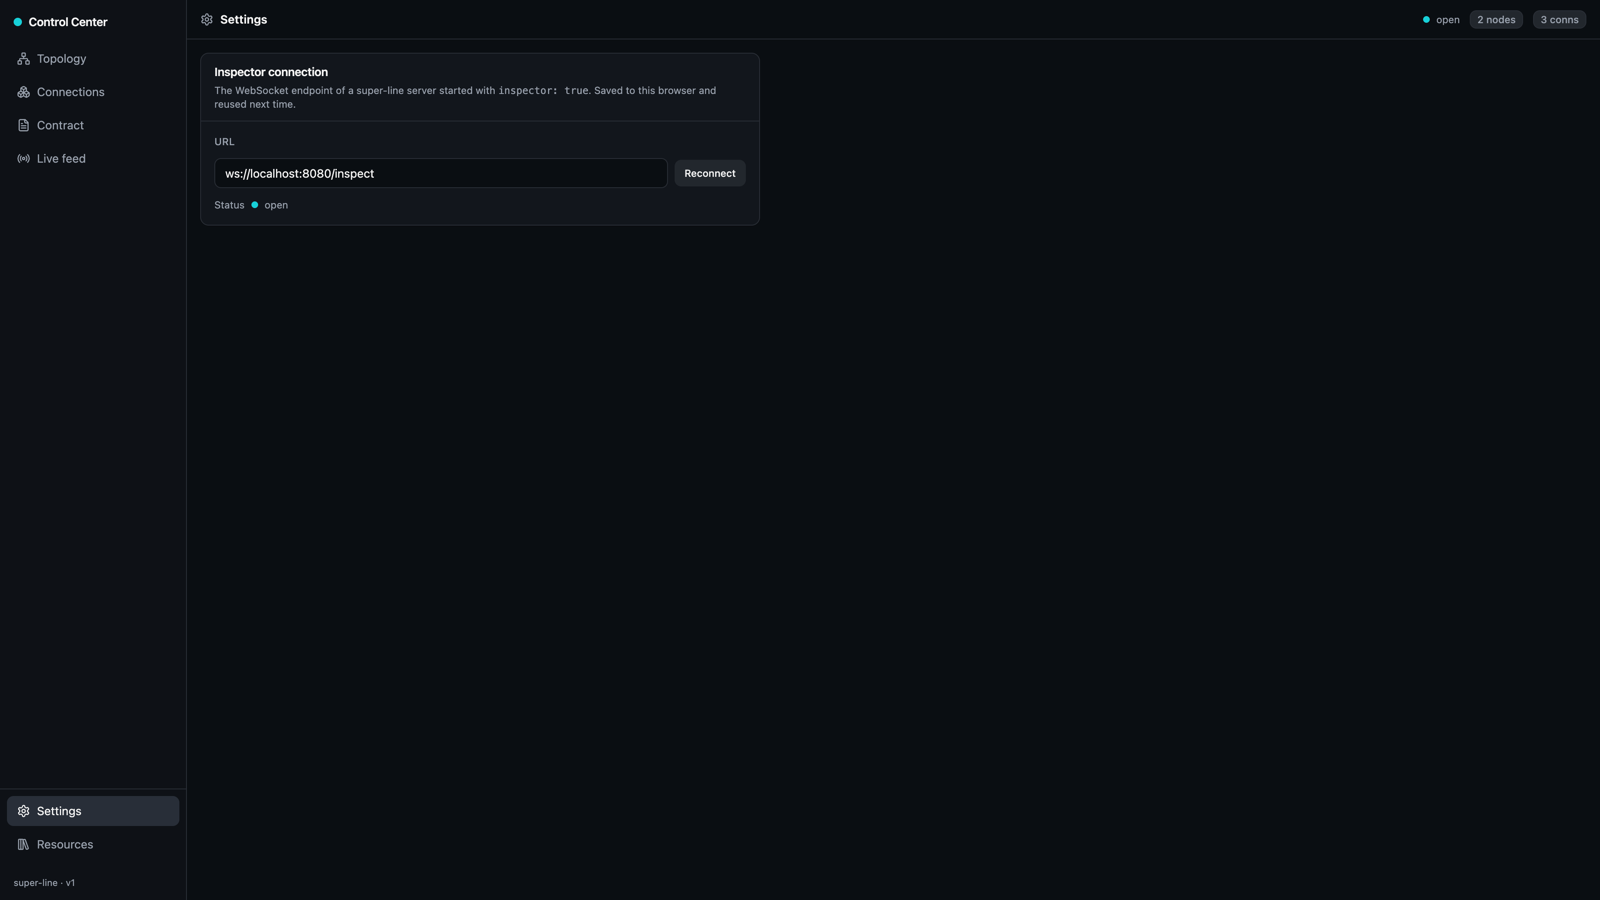
Settings
Point the Control Center at a different node. The inspector-connection URL is saved to your browser and reused next time; the status dot shows the live socket state.
Resources
A handful of jump-off cards — the home page, the documentation, the GitHub repo, and the @super-line/* packages on npm — so you can get from inspecting a cluster to the docs or source in one click.
How it works
Everything rides the WebSocket transport super-line already owns — the Control Center is itself a super-line-style client on the reserved channel. Contract structure comes from the in-process contract object; field-level schemas use the optional @standard-community/standard-json bridge when present, falling back to structure-only otherwise. Cluster reads come from the presence registry; live events — lifecycle, message, and collection traffic — reuse the same Adapter pub/sub fan-out as rooms and topics, so a single inspector sees the whole cluster.