
Control Center
One screen for your entire cluster: which node owns which socket, who's in which room, the live contract, and every message crossing the bus in real time. No console.logs, no extra instrumentation — flip one option and point the Control Center at any node.
It ships as @super-line/control-center and runs with npx — no install.
Enable the inspector
The Control Center connects over a reserved WebSocket subprotocol (superline.inspector.v1). Turn it on per node — the inspector is server-authoritative, so set inspector: true both on the server opts (gates the msg.* telemetry) and on the WebSocket transport (negotiates the subprotocol). It is off by default:
import { createSuperLineServer } from '@super-line/server'
import { webSocketServerTransport } from '@super-line/transport-websocket'

const srv = createSuperLineServer(contract, {
  transports: [webSocketServerTransport({ server, inspector: true })],
  authenticate,
  inspector: true,
})
Inspector connections bypass authenticate, are read-only, and are kept out of presence, the heartbeat, and local/cluster results — so the observer never shows up in what it observes.
Dev / trusted-network only
The inspector channel is unauthenticated in v1. Never enable inspector: true on an internet-facing production node. (A redact option lets you hide specific ctx/data field names: inspector: { redact: ['token'] }.)
Run it
npx @super-line/control-center --url ws://localhost:3000This serves the app on a local port and opens your browser. Change the endpoint from the Settings page at any time, or pass --port to pick the local port.
The views
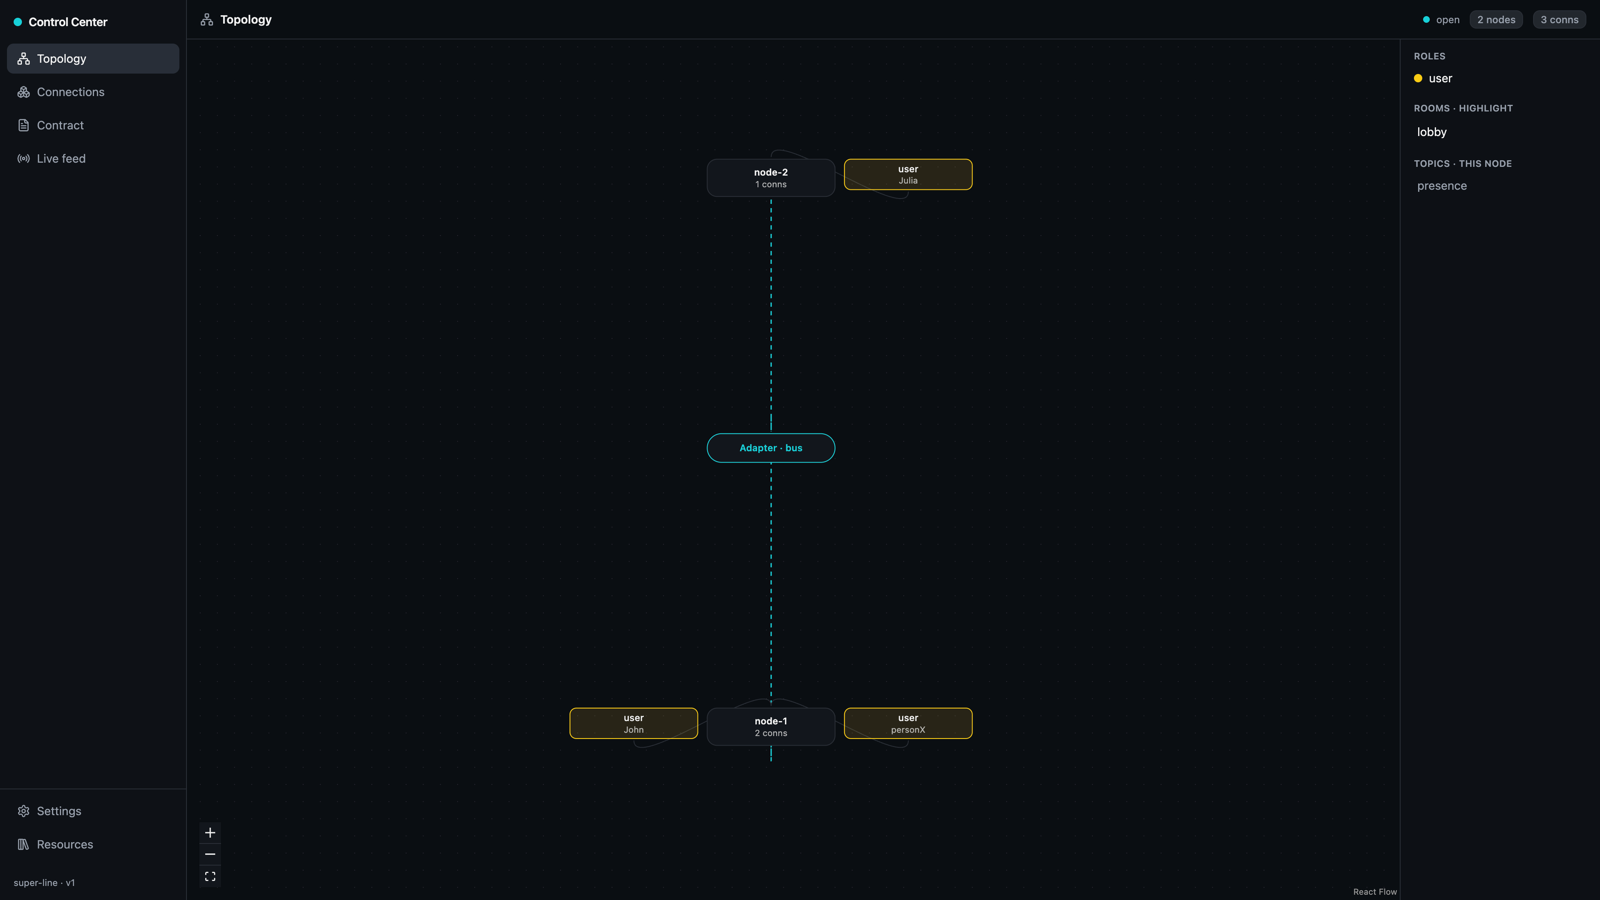
Topology
A hub-and-spoke graph of the whole cluster. The Adapter · bus sits at the center (multi-node clusters only — nodes have no direct sockets, they coordinate through the bus), server nodes around it, and each connection around its owning node. Connections are colored by role; selecting a room highlights its members across every node. The graph updates on every live event.
Connections
A table of every connection cluster-wide — role, id, user, owning node, rooms, and uptime.
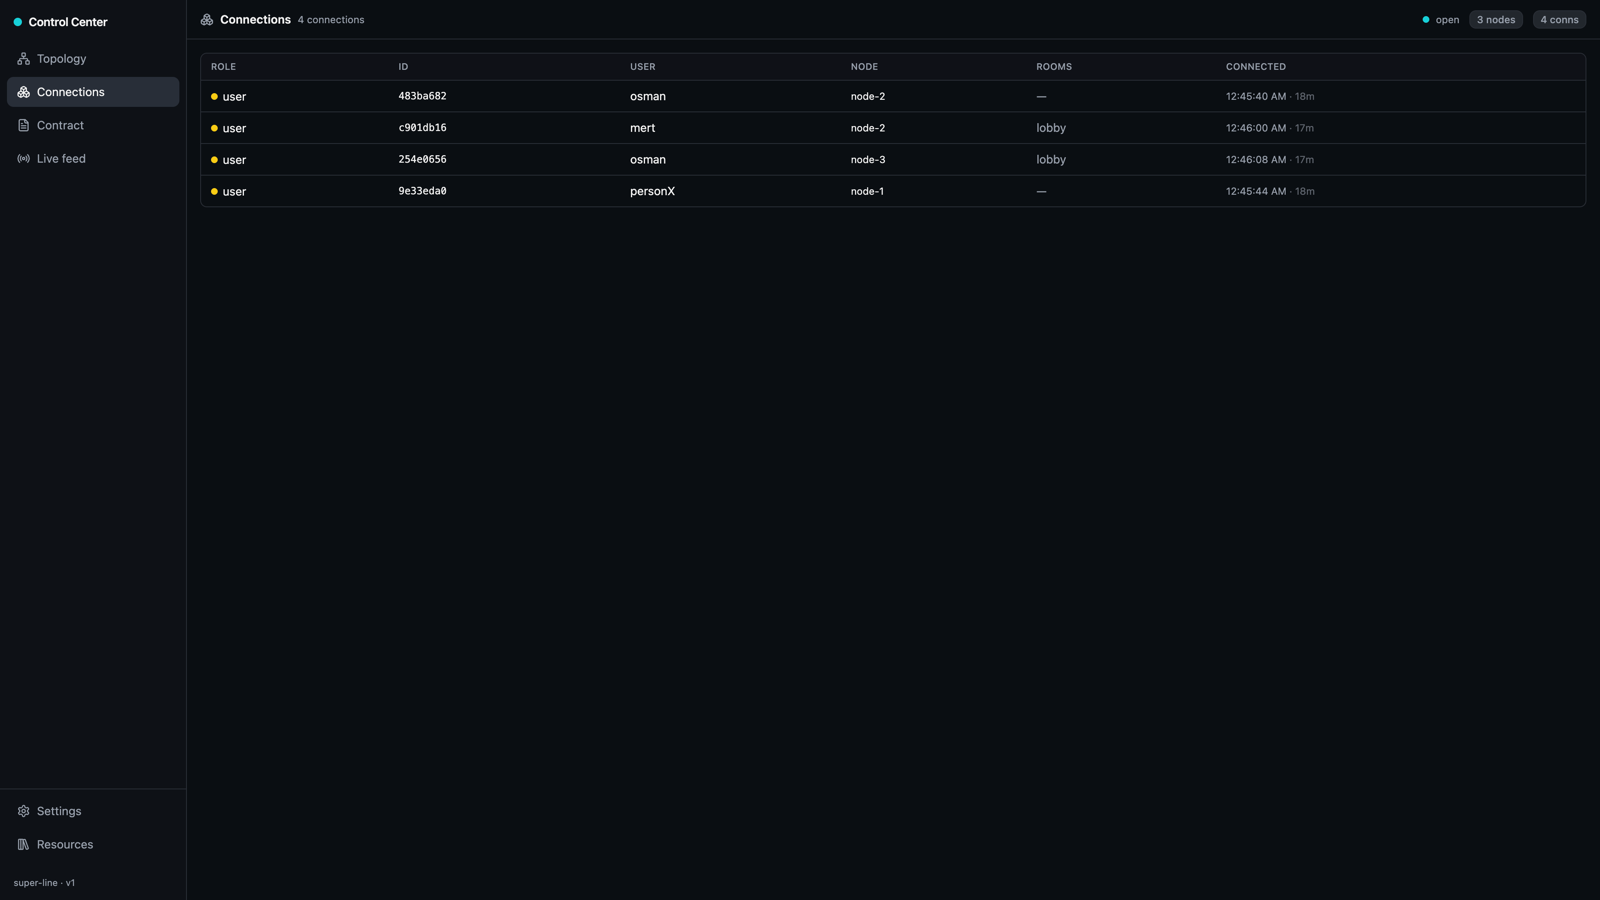
Click a row to open its descriptor plus a best-effort, node-local snapshot of ctx and conn.data. A connection owned by another node shows descriptor-only — point the Control Center at that node to read its ctx.
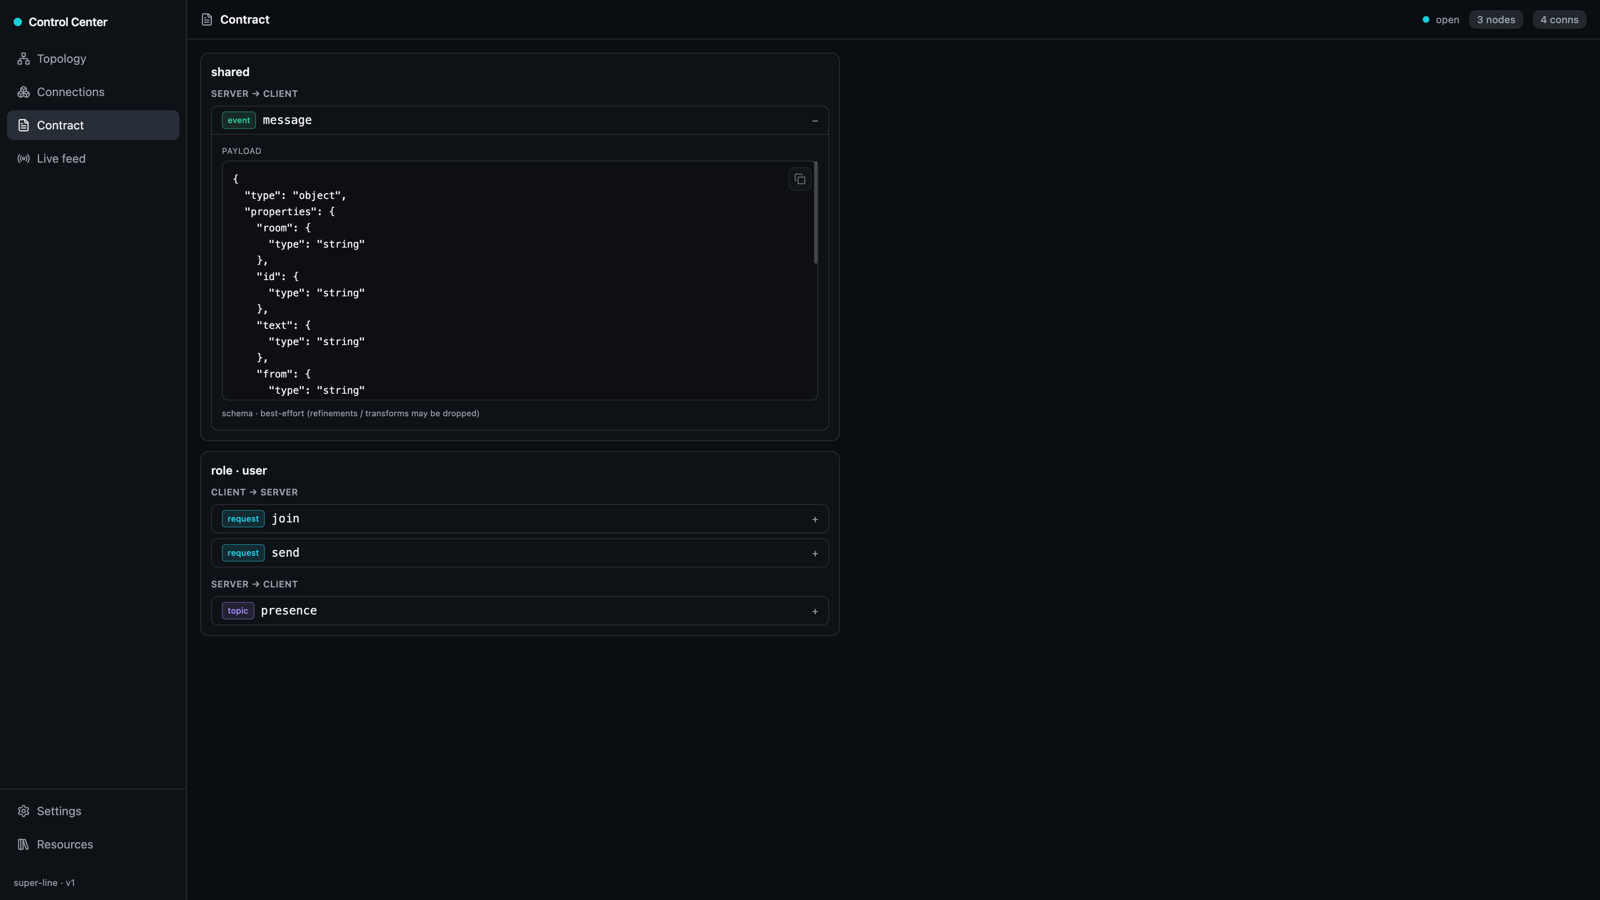
Contract
The full contract surface: shared and each role, split by direction with a flavor badge (request / event / topic) and an expandable best-effort JSON Schema per message.
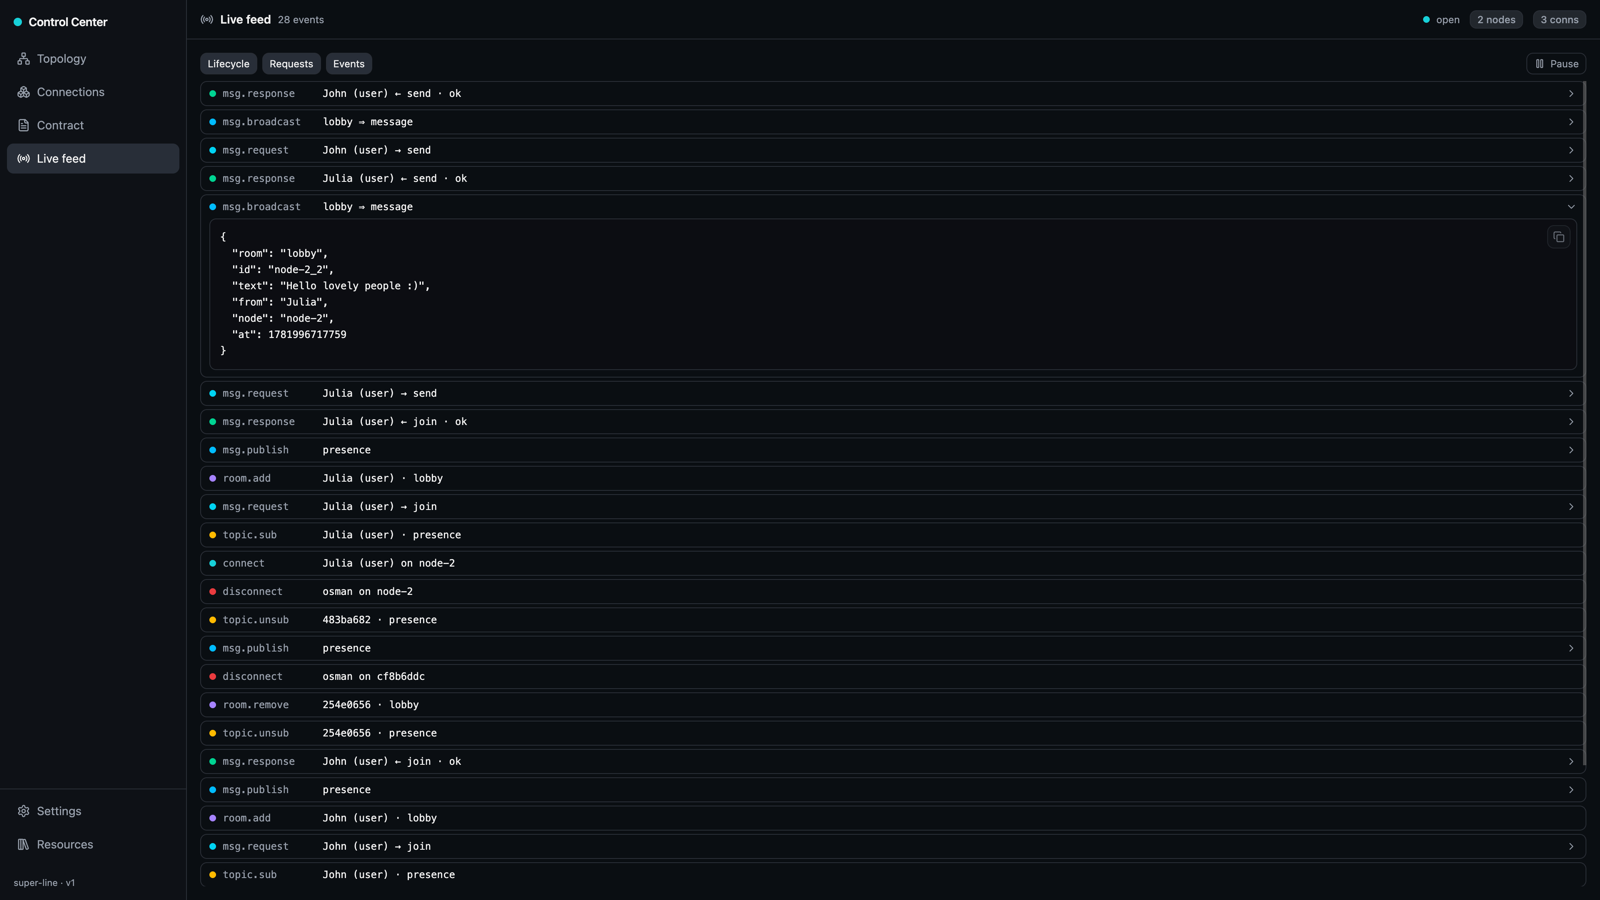
Live feed
Lifecycle churn — connect / disconnect / room.add / room.remove / topic.sub / topic.unsub — published on a reserved channel and fanned out cluster-wide via your Adapter, so an inspector on any one node sees events from every node.
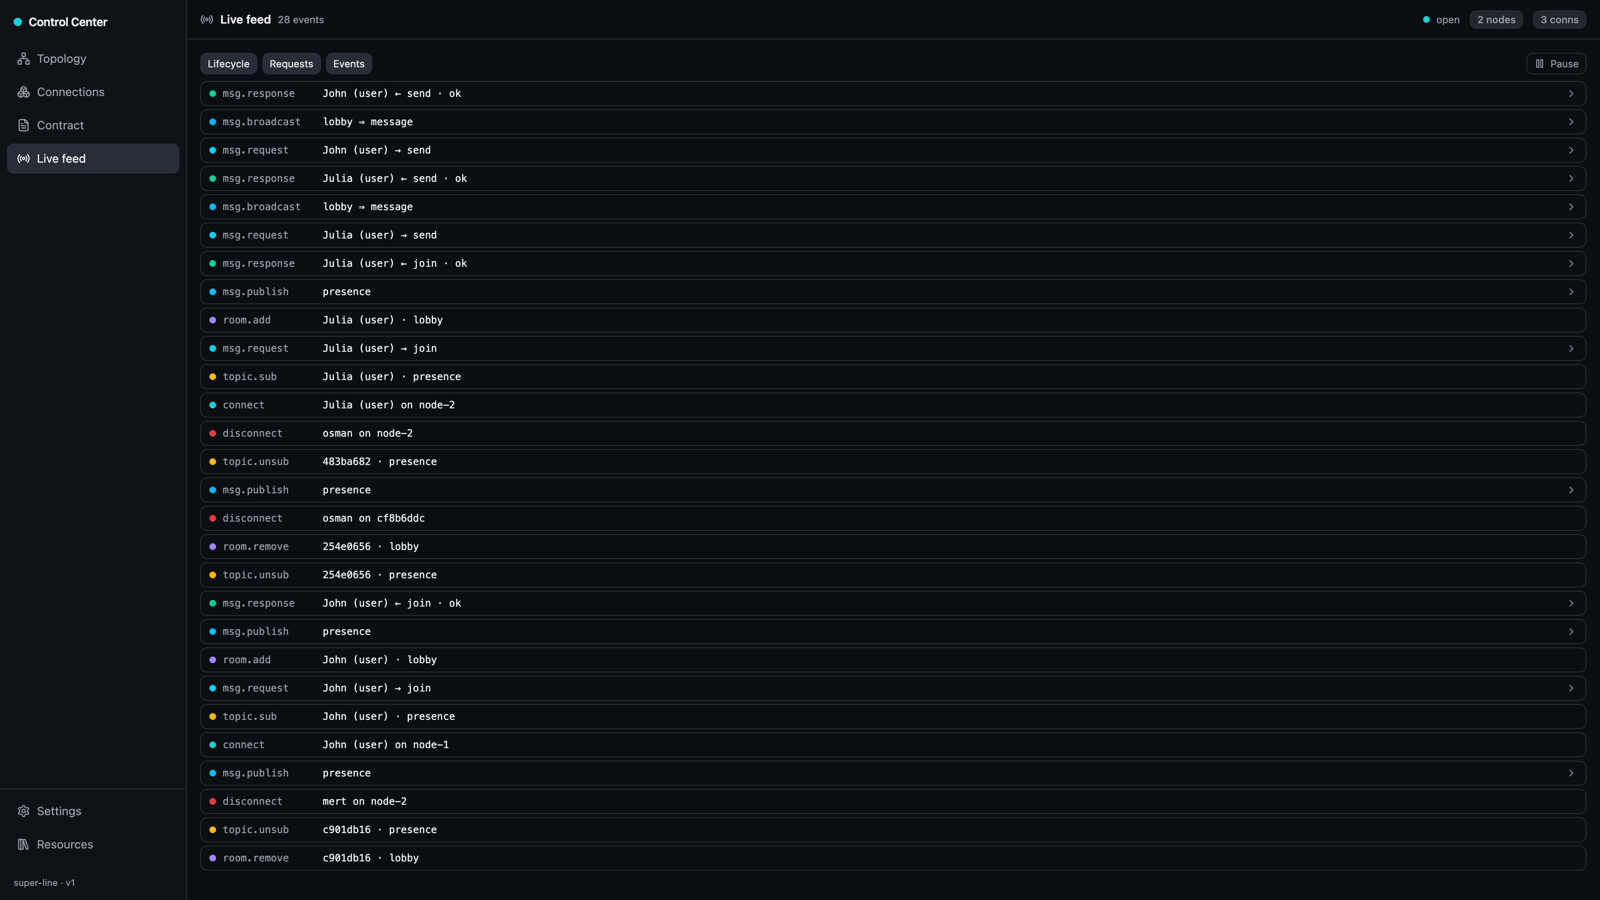
It also streams message traffic — msg.request / msg.response / msg.broadcast / msg.publish / msg.event, plus msg.serverRequest / msg.serverReply between nodes. Filter by Lifecycle, Requests, or Events, pause the stream, and expand any row to inspect its payload (redacted per your inspector.redact config).
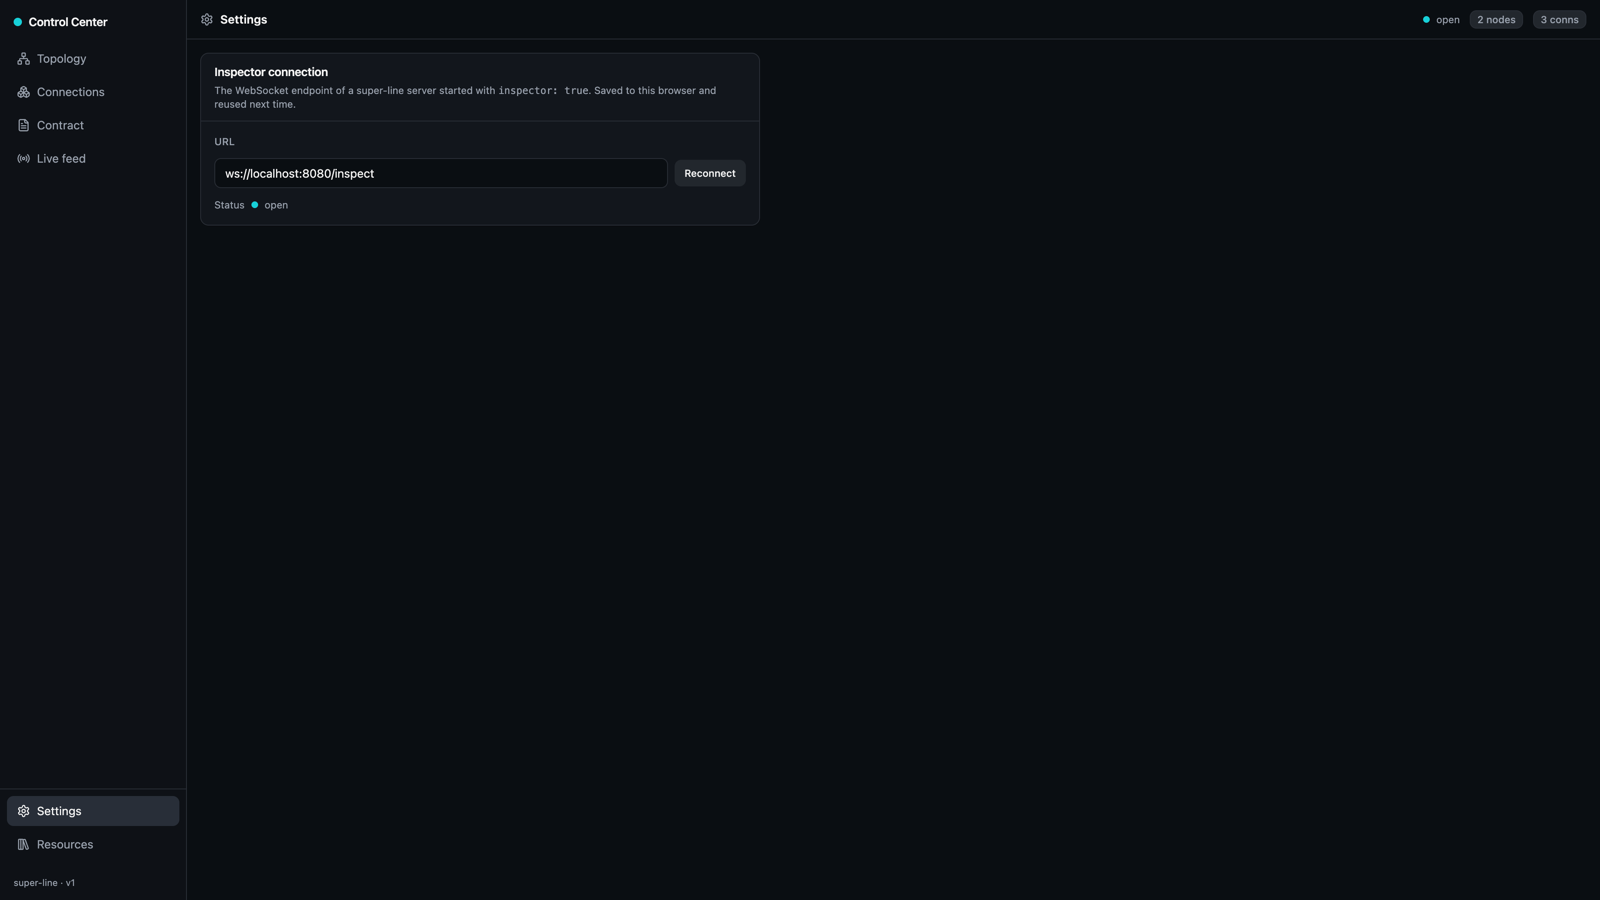
Settings
Point the Control Center at a different node. The inspector-connection URL is saved to your browser and reused next time; the status dot shows the live socket state.
How it works
Everything rides the WebSocket transport super-line already owns — the Control Center is itself a super-line-style client on the reserved channel. Contract structure comes from the in-process contract object; field-level schemas use the optional @standard-community/standard-json bridge when present, falling back to structure-only otherwise. Cluster reads come from the presence registry; live events — both lifecycle and message traffic — reuse the same Adapter pub/sub fan-out as rooms and topics, so a single inspector sees the whole cluster.